ABAP running slowly? Use SAT or the ABAP Profiler to find the expensive path
A manufacturing report processes many order items and runs slowly, but the developer needs evidence about which ABAP calls consume the time.

Source review:
START HERE · NO PRIOR TOPIC KNOWLEDGE NEEDED
What it is. Why it matters.
SAT is an ABAP runtime analysis tool. It measures where a program spends execution time, helping developers investigate slow work with evidence instead of guesses.
Completely new to SAP?
Manufacturers use SAP to connect work such as buying components, recording inventory, planning production, shipping equipment and accounting for costs. SAP S/4HANA is an enterprise resource planning system: it connects these activities through shared business data.
ABAP is SAP’s programming language for business applications. A program reads data, applies rules and produces a result. Start with the objects involved before investigating code.
A transaction code, or t-code, is a shortcut to a task in classic SAP GUI. Fiori apps provide another way to work. Names and screens depend on the product and release; you do not need a live system to learn the concepts in this guide.

Scope and source-review notes
Scope and evidence
Source review by FAST SAP SOLUTIONS® editorial. This badge describes our editorial review; it does not represent SAP certification or independent endorsement.
SAT and ADT ABAP Profiler concepts in supported classic/ADT backends; entry points, trace processing and views vary by release.
Primary documentation reviewed on 14 November 2026 using official indexed excerpts. Documentation review only; authored examples were not compiled or executed in an SAP system.
A MANUFACTURING EXAMPLE
Locate repeated work in a factory report
Measure one repeatable action
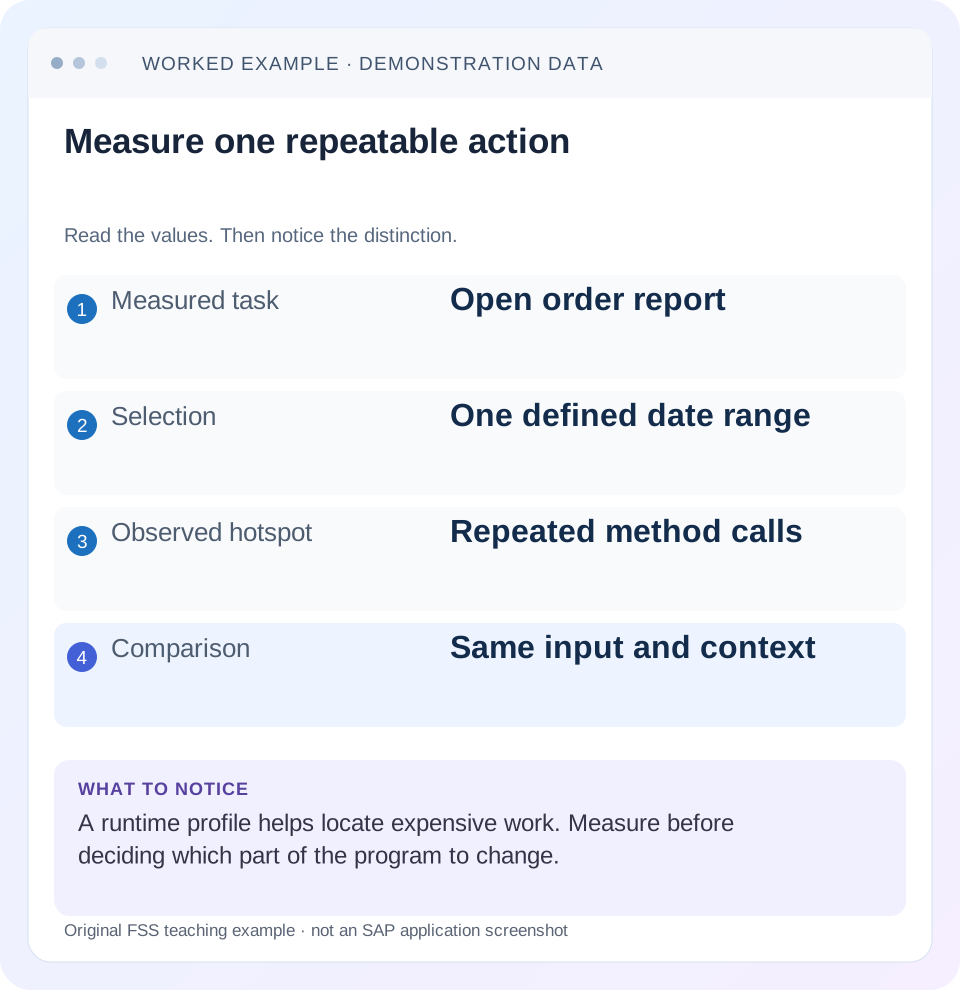
Read the example values
- Measured task
- Open order report
- Selection
- One defined date range
- Observed hotspot
- Repeated method calls
- Comparison
- Same input and context
Words you’ll meet in this guide
- Program
- A set of instructions executed by a computer.
- Class
- A reusable unit that groups data with operations called methods.
- Database
- Organized information kept beyond one program execution.
- Internal table
- A list of rows held temporarily in an ABAP program’s memory.
- Key
- One or more fields used to identify or find a record.
- ABAP
- SAP’s programming language for business applications.
- SQL
- A language used to read and work with database data.
- ADT
- ABAP Development Tools: SAP tools for ABAP development in Eclipse and, on supported systems, Visual Studio Code.
Preview the practical steps
SEE THE CONNECTION
See it in a simple example.
A small example to make the idea concrete.
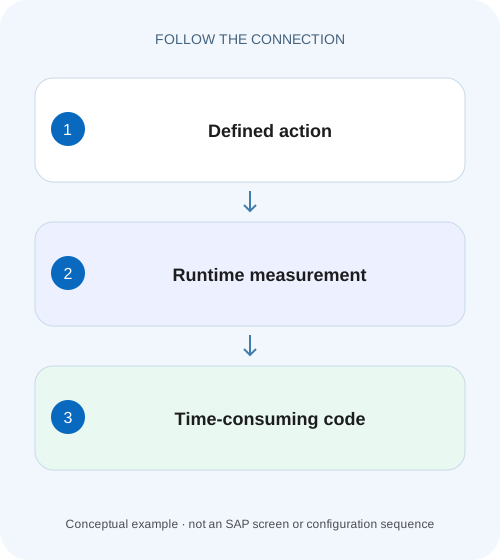
Locate repeated work in a factory report
A manufacturing report processes many order items and runs slowly, but the developer needs evidence about which ABAP calls consume the time.
Measure one slow action and follow its expensive call path
Use SAT or the release-appropriate ADT ABAP Profiler to determine where an ABAP execution spends time.
Scope, access and measurement boundaries
Choose the tool documented for your backend and development environment.
Distinguish total time, own time and execution count
Total or gross time includes subordinate work within a processing block.
Locate repeated work in a factory report
A manufacturing report processes many order items and runs slowly, but the developer needs evidence about which ABAP calls consume the time.
Profile the same scoped workload before choosing between reducing repeated calls and changing database access.
| Reader | Business question | Evidence to carry forward |
|---|---|---|
| SAP developers and application teams supporting manufacturers | Locate repeated work in a factory report | Profile the same scoped workload before choosing between reducing repeated calls and changing database access. |
01 Measure one slow action and follow its expensive call path
Use SAT or the release-appropriate ADT ABAP Profiler to determine where an ABAP execution spends time. Begin with a defined action and inspect the measured call hierarchy, hit counts and time attribution. The method containing the most source lines is not necessarily expensive; a short helper called thousands of times can dominate the request.
A profile locates work worth investigating. It does not automatically explain why a database call was slow, whether a remote dependency was overloaded or whether the selected business result was correct. This tutorial uses a fictional order report to turn runtime evidence into a specific optimization hypothesis and an equivalent before/after comparison.
02 Scope, access and measurement boundaries
Choose the tool documented for your backend and development environment. SAT is the classic ABAP Runtime Analysis transaction; ADT provides ABAP tracing and analysis views whose available features depend on backend and ADT versions. Their displays and processing of raw trace data are not identical, so do not expect every column or total to match across tools. [1]
Use an authorized representative test case with a defined selection. Record system/client, user context, program or request, input volume and whether caches are cold or warm. A user's fifteen-second browser wait includes more than an ABAP method in some architectures. State the measured boundary so you do not compare server execution directly with an unrelated end-to-end duration.
03 Distinguish total time, own time and execution count
Total or gross time includes subordinate work within a processing block. Own or net time excludes traced child operations according to the tool's attribution rules. If a report method calls a slow data reader, its total can be large while its own time is small. Summing parent and child total times double-counts overlapping intervals. [2]
Execution count tells you whether a cost came from one expensive event or many repeated events. An accumulated 2,000 milliseconds over 1,000 calls has a 2-millisecond average; one call taking 2,000 milliseconds suggests another shape of problem. An average can hide an outlier, so preserve call-sequence detail when the incident concerns an occasional long pause. [2]
04 Worked case: a report over 1,000 order items
Assume a fictional trace of Z_ORDER_REPORT for 1,000 items. Total server execution is 3,000 ms. LOAD_ITEMS accounts for 500 ms. ENRICH_ITEMS accounts for 2,200 ms, including 1,000 calls to READ_CUSTOMER totaling 2,000 ms. The remaining measured work is 300 ms outside those two major branches. These numbers are teaching inputs, not measurements from an SAP customer system.
The first hypothesis is repeated customer retrieval. If only twenty distinct customer keys occur, 1,000 helper invocations may repeat the same logical lookup. But the profile does not prove every call issued SQL; a helper could use buffering or spend time elsewhere. Expand READ_CUSTOMER and inspect its child events before proposing a bulk query or in-memory cache.
| Trace event | Executions | Total time | Interpretation |
|---|---|---|---|
| Report root | 1 | 3,000 ms | Complete measured server boundary |
| LOAD_ITEMS | 1 | 500 ms | Independent root branch |
| ENRICH_ITEMS | 1 | 2,200 ms | Includes READ_CUSTOMER |
| READ_CUSTOMER | 1,000 | 2,000 ms | Nested inside ENRICH_ITEMS |
| Other root work | various | 300 ms | Completes root reconciliation |
05 Choose aggregation for the question you need answered
Aggregated traces combine repeated events according to the chosen setting. A hit list is useful for ranking accumulated work and finding operations with high hit counts. A call hierarchy preserves caller relationships in an appropriate aggregated form. A non-aggregated trace retains individual sequence detail needed to investigate the precise path or an unusual invocation. [1]
SAP documents that the call-sequence view requires a non-aggregated trace in the described ADT tooling. If that view is unavailable, inspect the trace configuration rather than assuming the profiler failed. Recording more detail increases trace volume, so choose the smallest configuration that answers the present question. Preserve the setting with the result because aggregation changes what later analysis can recover. [3]
06 Capture a baseline in a repeatable sequence
Prepare the business fixture before starting the trace. Note which order range yields 1,000 items and twenty customer keys. Avoid including unrelated browsing or setup activity when you intend to profile only report execution. If the issue occurs only on first use, keep that as a separate cold-start experiment instead of warming the system and losing the symptom.
Write the expected output
Record item identities, count, key totals and the meaning of missing customer data.
Expected observation: A fast but incomplete output can be detected.
Choose trace scope and detail
Select the supported SAT or ADT start method and aggregation for one representative execution.
Expected observation: The request and required detail are captured.
Run once and stop collection
Execute the defined action and retain the trace reference, settings and input.
Expected observation: A bounded baseline exists.
Rank and navigate
Inspect high accumulated own/total time and counts, then follow the relevant callers into source.
Expected observation: The candidate hotspot belongs to the actual action.
07 Follow the costly child instead of editing the wrapper
In the worked case, ENRICH_ITEMS is not automatically the correct edit location just because its total is 2,200 ms. If 2,000 ms belongs to READ_CUSTOMER, optimize the reader's access pattern or its invocation count. If READ_CUSTOMER itself delegates almost all time to a remote call, local loop micro-optimizations may have little effect.
Calculate an upper bound before investing. Removing 100 ms of formatting cannot reduce a 3,000-ms execution by more than that 100 ms under the illustrative baseline. Even eliminating all 2,000 ms of customer-read work would leave approximately 1,000 ms elsewhere. This arithmetic is not a speedup promise; it keeps optimization effort proportional to the measured contribution.
08 Move to SQL or dependency analysis when the evidence points there
If the trace shows database work in the repeated reader, use an appropriately scoped SQL trace such as ST05 to inspect executions, parameters and returned rows in supported classic landscapes. That distinguishes repeated inexpensive reads from one expensive statement. It can also reveal that the helper did not hit the database on every invocation.
If a remote call dominates, correlate its duration and outcome with the dependency's diagnostics. If internal-table work dominates, inspect key design and nested loops. Keep the original trace intact and document which evidence supports the next hypothesis. A runtime profile and a SQL trace answer related but different questions; neither replaces result verification.
09 Troubleshooting incomplete or misleading measurements
Before declaring a tool result surprising, check whether you traced the intended user, process, execution phase and selection. An empty trace or unexpectedly small duration may reflect scope rather than an absence of expensive work.
| Observation | Question | Next step |
|---|---|---|
| Large parent total; small own time | Which child accounts for the duration? | Expand the hierarchy |
| Thousands of cheap calls | Is repeated work avoidable? | Compare distinct keys and caller loop |
| One slow event | Database, remote or local processing? | Inspect the event and appropriate dependency evidence |
| Call sequence unavailable | Was aggregation enabled? | Record a suitable non-aggregated test |
| Profile quick; browser slow | Does the trace exclude frontend/network/other requests? | Align end-to-end boundaries |
| After-change result much faster | Were inputs and cache state equivalent? | Repeat comparable controlled cases |
10 Design an equivalent correction experiment
Suppose code review confirms repeated reads for twenty customer keys. A proposed alternative gathers those keys once and performs a supported set read or keyed lookup strategy. Preserve item sequence, authorization behavior, customer validity context and missing-key handling. A cache keyed only by customer ID can be wrong if results also depend on language or another business dimension.
Use a fresh controlled fixture or comparable state for each candidate. Do not execute both versions against a changing dataset and treat a different row population as evidence of efficiency. Record the source revision and measurement settings. The aim is to explain why work was reduced while the business contract remained the same.
11 Verification includes correctness, scale and uncertainty
For a positive check, the revised report must return the same 1,000 item identities and expected enriched fields. For a negative check, include an unknown customer and verify the intended blank or error outcome. For a boundary check, run an empty selection and a larger representative selection within the authorized test scope. This can reveal a fixed setup cost or a scaling problem hidden by one size.
Then compare trace evidence: invocation counts, accumulated time in the hotspot and overall execution under comparable conditions. Report actual ranges or repeated observations where variability matters. If a difference is smaller than run-to-run variation, state that uncertainty instead of promoting the best run. This article supplies an experiment design, not executed performance results.
12 Frequently asked questions and a useful handover
Should I start with SAT or ST05? Use the tool that answers the uncertainty. When you do not know where ABAP time goes, runtime profiling is a useful starting point. When evidence already points to SQL execution details, a SQL trace is more direct.
Why do totals differ between views? Aggregation, filters and time attribution affect presentation. Read the documented column definitions and avoid summing nested totals.
Does profiling every statement reveal everything? Trace settings determine recorded events, and profiling adds overhead. Capture the detail needed for the question rather than assuming maximum detail is always better.
A useful handover contains the representative action, trace ID/settings, top call path, hypothesis, proposed correction, output assertions and actual comparison results. Keep measured facts separate from untested explanations so another developer can continue without reproducing the entire investigation.
Related services and next steps
Primary sources
Found this useful?
Share this guide with your network, or leave a like.
Your like is saved in this browser.