SAP HANA calculation views: Model the result before optimizing the query
A manufacturer models component and order data in a calculation view and needs meaningful measures before pursuing performance improvements.

Source review:
START HERE · NO PRIOR TOPIC KNOWLEDGE NEEDED
What it is. Why it matters.
A calculation view defines how SAP HANA combines and calculates data for reporting. Its fields, relationships and filters determine the result before performance tuning begins.
Completely new to SAP?
Manufacturers use SAP to connect work such as buying components, recording inventory, planning production, shipping equipment and accounting for costs. SAP S/4HANA is an enterprise resource planning system: it connects these activities through shared business data.
SAP HANA is a database platform. Data models describe how records relate; queries ask for results. Start with the intended result before looking at storage or performance.
A transaction code, or t-code, is a shortcut to a task in classic SAP GUI. Fiori apps provide another way to work. Names and screens depend on the product and release; you do not need a live system to learn the concepts in this guide.

Scope and source-review notes
Scope and evidence
Source review by FAST SAP SOLUTIONS® editorial. This badge describes our editorial review; it does not represent SAP certification or independent endorsement.
Graphical SAP HANA calculation-view semantics in supported HANA Platform/HANA Cloud development tools. The tutorial uses customer-owned fixture tables, explicit grain, multilingual text joins, currency context and ratio calculations; editor/deployment details vary by release.
Documentation review on 14 November 2026 using official SAP sources and indexed official excerpts where full Help text was unavailable. Scope and service or release differences are explained in the lesson. All datasets, requests and checks are illustrative; no customer SAP runtime execution or measured results are claimed.
A MANUFACTURING EXAMPLE
Model the intended grain of a manufacturing report
Understand the result grain
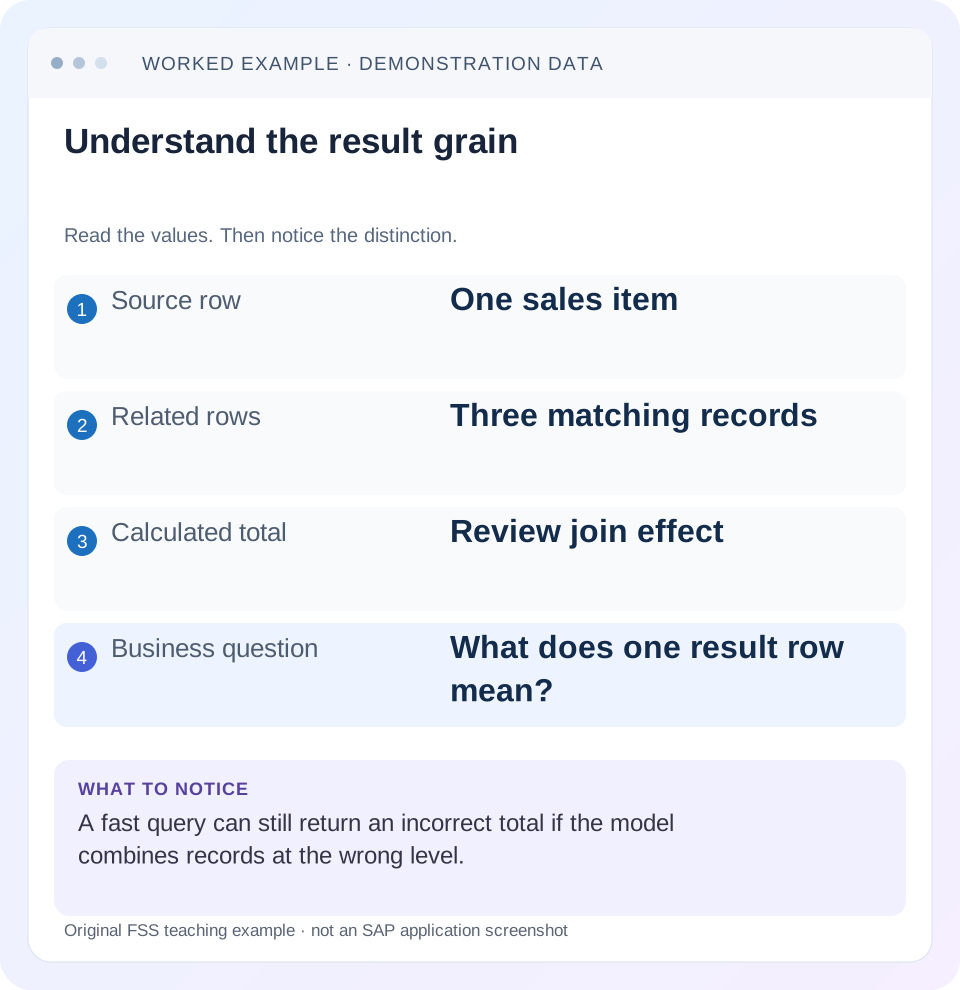
Read the example values
- Source row
- One sales item
- Related rows
- Three matching records
- Calculated total
- Review join effect
- Business question
- What does one result row mean?
Words you’ll meet in this guide
- Query
- A request to retrieve or calculate data.
- Table
- Data organized into rows and columns.
- Persistence
- Keeping data in storage so it survives beyond memory.
- HANA
- SAP’s database platform.
- SQL
- A language used to read and work with database data.
Preview the practical steps
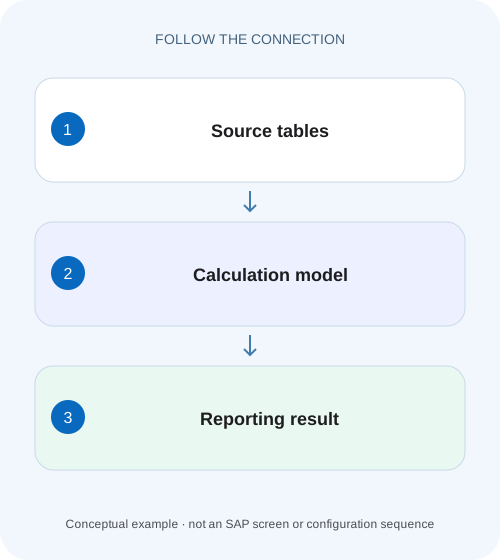
SEE THE CONNECTION
See it in a simple example.
A small example to make the idea concrete.
Model the intended grain of a manufacturing report
A manufacturer models component and order data in a calculation view and needs meaningful measures before pursuing performance improvements.
Define the result grain before adding nodes or tuning performance
A calculation view models a result: which business objects its rows represent, how sources relate and how measures aggregate.
Understand projection, join, aggregation and semantics roles
A projection selects and transforms source columns and can restrict rows.
Worked case: three product texts multiply two sales items
Imagine sales items S1 for product P1 with 100 EUR, S2 for P1 with 50 EUR and S3 for P2 with 40 USD.
Model the intended grain of a manufacturing report
A manufacturer models component and order data in a calculation view and needs meaningful measures before pursuing performance improvements.
Check grain, joins, units and expected result rows before optimizing a query that may already express the wrong business relationship.
| Reader | Business question | Evidence to carry forward |
|---|---|---|
| SAP developers and application teams supporting manufacturers | Model the intended grain of a manufacturing report | Check grain, joins, units and expected result rows before optimizing a query that may already express the wrong business relationship. |
01 Define the result grain before adding nodes or tuning performance
A calculation view models a result: which business objects its rows represent, how sources relate and how measures aggregate. Start by stating the grain, such as one sales item, and the expected totals at each reporting level. A view that activates and returns rows can still multiply revenue, drop unmatched facts or add incompatible currencies. Verify those semantics before optimizing the execution plan. [1] [2]
This tutorial is for HANA modelers working with graphical calculation views in a supported HANA Platform or HANA Cloud development environment. You need authorized model access and small fixture data. Editor layouts and deployment artifacts differ across releases. The tables and SQL below are authored teaching examples, not SAP application tables or an executed customer model.
02 Understand projection, join, aggregation and semantics roles
A projection selects and transforms source columns and can restrict rows. A join relates sources and can change row multiplicity. Aggregation defines how measures combine over retained attributes. The Semantics node describes output attributes and measures and associates meaning such as amount and currency. These roles work together; labeling an amount cannot undo a join that tripled its contributing rows. [4]
SAP describes attributes as descriptive grouping columns and measures as quantities requiring aggregation. When consuming a calculation view through SQL, aggregate measures according to the intended grouping. Do not assume a reporting tool and an ad hoc SQL query will ask for exactly the same grain merely because they select similarly named fields. [1]
03 Worked case: three product texts multiply two sales items
Imagine sales items S1 for product P1 with 100 EUR, S2 for P1 with 50 EUR and S3 for P2 with 40 USD. Product text contains P1 descriptions in EN, DE and FR, and one EN description for P2. Joining sales to text only by product gives each P1 sales item three matches. The EUR contribution becomes 100 × 3 + 50 × 3 = 450 instead of 150.
The USD contribution remains 40 because P2 has one text. An unqualified grand total of 490 also mixes currencies and is not meaningful revenue. There are therefore two independent defects: duplicate fact contributions and incompatible aggregation context. Correcting only the currency label still leaves 450 EUR. Filtering only the chart to EUR still leaves the duplication.
| Sales item | Product | Amount | Currency |
|---|---|---|---|
| S1 | P1 | 100 | EUR |
| S2 | P1 | 50 | EUR |
| S3 | P2 | 40 | USD |
| Context | Expected | Join without language restriction |
|---|---|---|
| EUR | 150 | 450 |
| USD | 40 | 40 |
| Fact-item count | 3 | 7 joined rows |
04 Repair the relationship before declaring cardinality
If the business report needs English descriptions, restrict the text relationship to EN and verify uniqueness for product plus language. A declared many-to-one cardinality is an assertion about the data relationship; it is not a command that deduplicates several matching texts. SAP warns that valid cardinality matters for both results and optimization. [2]
Use a left join when sales without a matching description should remain in the report. In the illustrative SQL, the language condition belongs in the join condition to preserve unmatched facts. Moving t.LANGUAGE = 'EN' into a WHERE clause can reject rows whose text is absent and alter the intended left-join behavior. Choose based on the business contract, then test missing descriptions.
SELECT s.CURRENCY, SUM(s.NET_AMOUNT) AS NET_AMOUNT
FROM SALES_ITEM s
LEFT JOIN PRODUCT_TEXT t
  ON t.PRODUCT_ID = s.PRODUCT_ID
 AND t.LANGUAGE = 'EN'
GROUP BY s.CURRENCY;
05 Inspect row identities through the model
Preview a small known selection at the source, after the join and at the final aggregation using supported tools. Keep sales-item identity visible during diagnosis even if the final report omits it. Count matches per source item. For S1, one contribution is expected after the language restriction; three indicates an unresolved relationship issue.
If duplicates remain, inspect the full business key: product, language, validity period, organizational scope or another required discriminator. Do not delete arbitrary duplicate rows in a projection simply because the total then looks correct. Determine whether the source contains erroneous duplicates or whether the model omitted a legitimate key dimension.
Also inspect facts that disappear. An inner join can remove S3 if its text is missing. A measure total matching expectation in one fixture does not prove all fact identities survived. Compare both contributing item sets and grouped totals.
Extend the text fixture by giving P1 two EN rows with different validity periods. Product plus language is now insufficient unless the report intentionally needs historical texts. Select the intended effective date and verify that at most one valid row matches each fact under the business rule. An optimizer cardinality setting cannot choose the correct historical description. This case also explains why a relationship validated on today’s data must be rechecked when source history or target data changes.
06 Associate amounts with currencies and quantities with units
SAP provides semantic assignments for amounts with currency codes and quantities with units. For the fixture, NET_AMOUNT must remain associated with CURRENCY. Keep EUR and USD separate unless the model performs a supported, explicitly configured conversion. A display currency label alone is not evidence that values were converted. [3] [4]
For conversion, define the target currency, rate type, conversion date, source client/context and required rate data according to the relevant HANA modeling guide. Test missing-rate and rounding behavior. This lesson does not invent a universal exchange rate or assume every project has the same conversion tables available. Original and converted measures should be distinguishable so a consumer cannot add both as if they were separate revenue.
07 Calculate ratios at the correct aggregation level
Not every numeric field is additive. Consider two EUR sales lines: quantity 2 at unit price 10 and quantity 3 at unit price 20. Their amounts are 20 and 60, total amount 80 and total quantity 5. The weighted unit price is 80 ÷ 5 = 16. Summing prices gives 30 and taking a simple average gives 15; neither expresses this weighted business measure.
Define whether a calculation happens before or after aggregation and verify its behavior when grouping changes. A row-level ratio subsequently summed can differ from a ratio of aggregated numerators and denominators. Include a zero-denominator case with an explicit business rule. Do not hide divide-by-zero or missing data by returning an unexplained zero that looks like a valid price.
08 Make filters and parameters part of the result contract
Record which filters restrict the source and which restrict an aggregated result. A sales-date filter changes contributing facts; a threshold applied after aggregation selects groups based on their totals. Moving a condition between those stages can change meaning even if it improves a plan.
For user-supplied parameters, define accepted values, defaults and missing-value behavior using the supported model settings. Verify that a restrictive test selection did not conceal duplicate text relationships or missing currencies. Also compare technical access privileges with row-level authorization behavior required by the model. Correct business semantics and authorized data visibility are separate acceptance conditions.
09 Troubleshoot wrong totals before attempting performance hints
Use the first point where identities or values diverge from the fixture. A final chart adjustment cannot repair every downstream consumer of a wrong model. Cardinality changes used as optimization shortcuts are particularly dangerous if the data does not satisfy the declared relationship.
| Observation | Likely question | Next check |
|---|---|---|
| Revenue multiplied by text count | Is the join key complete? | Product/language/validity and matches per fact |
| Facts missing with no description | Was an inner relationship intended? | Join type and missing-reference fixture |
| Mixed-currency grand total | Was currency retained or converted? | Semantic association and conversion definition |
| Ratio changes unexpectedly by grouping | At which stage is it calculated? | Numerator/denominator aggregation |
| SQL and chart totals differ | Do they request the same grain? | Selected attributes, filters and measure aggregation |
| Fast preview, slow broad query | Is the workload representative? | Plan, volume and filters after correctness checks |
10 Verify positive, negative and boundary fixtures
For the positive case, restrict text to the intended language and verify S1, S2 and S3 contribute once. Expected grouped amounts are 150 EUR and 40 USD. Include the descriptions in one query and omit them in another; measure results should remain consistent with the verified relationship and supported optimization behavior.
For a negative fixture, add a second EN text for P1. The validation should expose that the asserted uniqueness no longer holds rather than silently accepting a multiplied amount. For a boundary fixture, remove P2’s text and verify whether the intended left-join contract retains its 40 USD fact. Keep the missing description visible or deliberately labeled.
Add the weighted-price fixture and a zero quantity. Verify detailed rows, grouped amounts, quantities and calculated ratios. Test the same model after transport against representative target data because cardinality validation on one development dataset is not a permanent guarantee for another environment. [5]
11 Optimize only against the verified semantic baseline
Once results are correct, inspect a representative execution plan and resource observations through the supported HANA tooling. Compare selected volume, join relationships, filters and aggregation placement. Preserve the fixture as a regression baseline while changing the design. A faster plan that drops S3 or repeats S1 is not an improvement.
What should the model review say? State one-row meaning, source keys, join multiplicity, unmatched-fact policy, aggregation functions, currency/unit context and expected fixture totals. Include the consumer query and authorization scope. This makes optimization reviewable because every performance change has a result contract to preserve.
Can a calculation view fix poor source data? It can implement an agreed transformation, but it should not conceal unknown duplicates or invent business values. Reconcile those with the source owner. The related storage and Datasphere lessons address physical access and freshness after this model’s meaning is established.
Related services and next steps
Primary sources
Found this useful?
Share this guide with your network, or leave a like.
Your like is saved in this browser.