SAC currency conversion missing or unexpected? Check date, rate type and rate table
A manufacturer compares costs from factories reporting in different currencies and needs to explain the conversion result.

Source review:
START HERE · NO PRIOR TOPIC KNOWLEDGE NEEDED
What it is. Why it matters.
SAP Analytics Cloud can translate measures between currencies. The source currency, target currency, rate type and relevant date all contribute to the converted value.
Completely new to SAP?
Manufacturers use SAP to connect work such as buying components, recording inventory, planning production, shipping equipment and accounting for costs. SAP S/4HANA is an enterprise resource planning system: it connects these activities through shared business data.
Analytics organizes business data into useful comparisons. Planning adds proposed future values. Learn what the numbers represent before comparing totals or changing a forecast.
A transaction code, or t-code, is a shortcut to a task in classic SAP GUI. Fiori apps provide another way to work. Names and screens depend on the product and release; you do not need a live system to learn the concepts in this guide.

Scope and source-review notes
Scope and evidence
Source review by FAST SAP SOLUTIONS® editorial. This badge describes our editorial review; it does not represent SAP certification or independent endorsement.
SAP Analytics Cloud currency conversion in standard models with multiple measures. Account models and live-source conversions have different controls; tenant release, structure priority and model configuration must be checked.
Documentation review on 14 November 2026 used the official SAP sources listed below, including indexed excerpts where full text was unavailable. Scope and availability depend on the stated product, release and configuration. All document references, quantities, dates and outcomes in worked cases are illustrative; no customer SAP system or tenant was accessed and the proposed exercises were not executed.
A MANUFACTURING EXAMPLE
Compare plant costs in a common currency
Date and rate type select different results
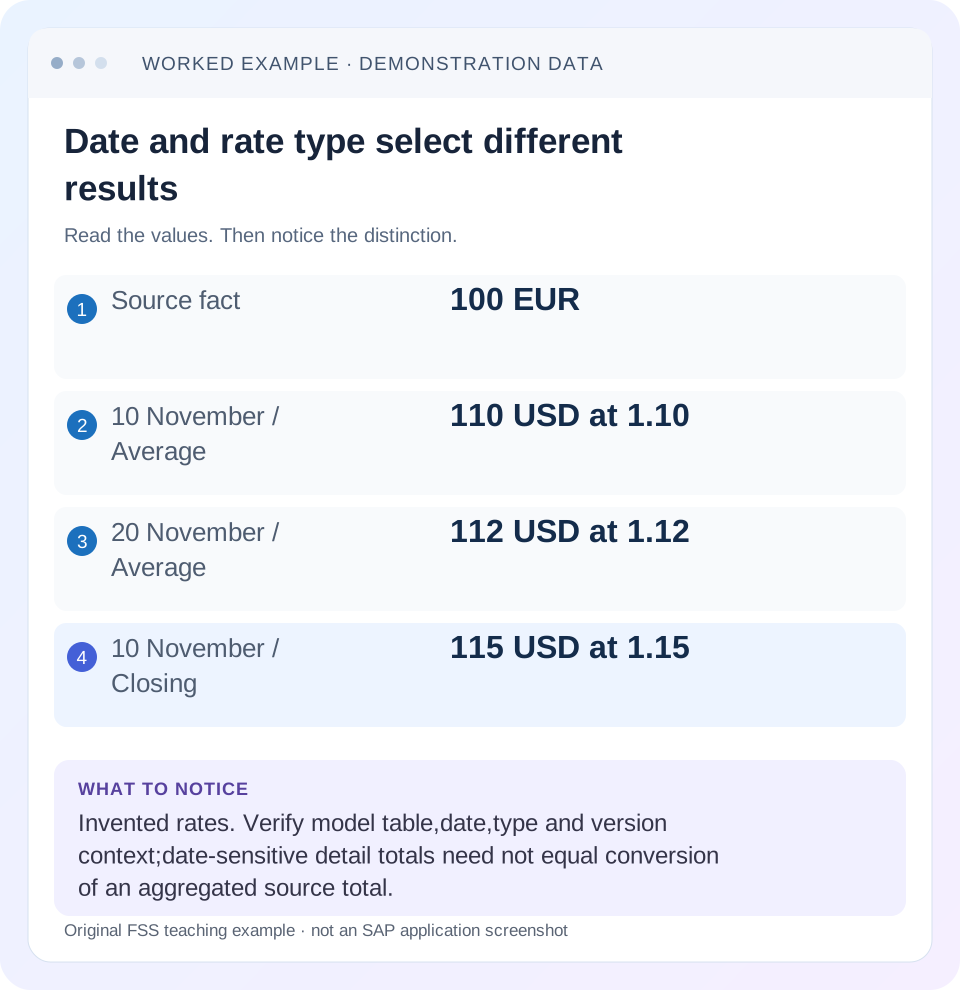
Read the example values
- Source fact
- 100 EUR
- 10 November / Average
- 110 USD at 1.10
- 20 November / Average
- 112 USD at 1.12
- 10 November / Closing
- 115 USD at 1.15
Words you’ll meet in this guide
- Dimension
- A way to group data, such as month or product.
- Measure
- A numeric value, such as revenue or quantity.
- Model
- A defined organization of data and calculation rules.
- SAC
- SAP Analytics Cloud: a cloud application for analytics and planning.
Preview the practical steps
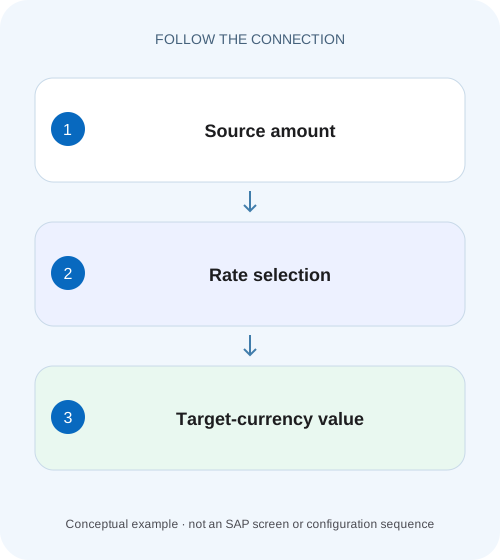
SEE THE CONNECTION
See it in a simple example.
A small example to make the idea concrete.
Compare plant costs in a common currency
A manufacturer compares costs from factories reporting in different currencies and needs to explain the conversion result.
Diagnose one converted value before the total
A missing or unexpected currency result usually needs a complete conversion context, not another rate entered at random.
Understand what selects the rate
SAP documents each conversion-table row using source currency, target currency, Valid From and an exchange rate.
Set up a small manufacturing-cost fixture
Suppose a model contains maintenance expense in EUR and a USD conversion measure.
Compare plant costs in a common currency
A manufacturer compares costs from factories reporting in different currencies and needs to explain the conversion result.
Align rate type, date and currency context before interpreting a converted difference as a real operating-cost change.
| Reader | Business question | Evidence to carry forward |
|---|---|---|
| SAP developers and application teams supporting manufacturers | Compare plant costs in a common currency | Align rate type, date and currency context before interpreting a converted difference as a real operating-cost change. |
01 Diagnose one converted value before the total
A missing or unexpected currency result usually needs a complete conversion context, not another rate entered at random. Record the source amount and currency, target currency, relevant model date, rate type, rate version/category and selected rate table. Then reproduce one cell. A grand total can combine many dates and currency pairs and hide the first mismatch.
This tutorial is for SAC modelers and report support analysts with access to model settings, the conversion table and a small known data slice. It focuses on SAC standard-model conversion. If a live BW query already converts the amount, inspect that source calculation first; a rate table in SAC may not participate at all. The rates below are invented teaching values, not financial recommendations or market rates.
02 Understand what selects the rate
SAP documents each conversion-table row using source currency, target currency, Valid From and an exchange rate. The source amount is multiplied by the rate. Valid From starts its effective period; an earlier fact without an applicable prior rate is not converted. Rate type must also match the account or measure's requested type. A blank type does not match closing or average. [1]
In a standard model, the configured rate table and date dimension determine conversion context. Multiple measures and an account dimension can introduce structure-priority considerations. Identify which structure supplies the effective rate type. A correct average rate in an unused table cannot explain a measure that requests closing from another table. [2]
03 Set up a small manufacturing-cost fixture
Suppose a model contains maintenance expense in EUR and a USD conversion measure. It uses cost date for conversion and the Average rate type. The illustrative table has EUR-to-USD Average 1.10 valid from 1 November and 1.12 valid from 15 November. A separate Closing rate of 1.15 exists from 1 November. Assume no additional row changes the relevant selection.
The two Average facts total 222 USD after date-sensitive conversion. Multiplying their 200-EUR total by 1.12 gives 224 USD and answers a different question. Explain whether the business wants conversion by the configured fact-date context or a deliberate fixed-date analysis. Do not change the model to make those two distinct questions coincidentally agree.
| Source fact | Requested context | Expected arithmetic |
|---|---|---|
| 10 November,100 EUR | Average / EUR to USD | 100 × 1.10 = 110 USD |
| 20 November,100 EUR | Average / EUR to USD | 100 × 1.12 = 112 USD |
| 10 November,100 EUR | Closing / EUR to USD | 100 × 1.15 = 115 USD |
| 31 October,100 EUR | Average; no earlier rate | No applicable maintained rate |
04 Check units and currency identity first
An amount of 100 without its currency is incomplete. Confirm whether currency comes from a measure setting, an organizational member or the imported fact context supported by the model. A currency label added to a chart does not convert values. Likewise, display scaling can make 100,000 appear as 100 thousand without changing the underlying amount.
In a mixed-currency dataset, do not sum EUR and USD source values and then label the result USD. First establish a common reporting currency through the intended conversion. Retain a source-currency reference in the investigation so you can distinguish a rate-selection defect from a wrong imported amount or currency assignment.
05 Trace model and story context in order
Use the same model, version, date and measure as the affected story. Filters and calculated measures can change what a visible cell represents. Begin with a narrow table where the relevant entity, date and currency are explicit.
Capture the unconverted fact
Record maintenance expense 100 EUR, its entity, date and version.
Expected observation: The source amount and currency are independently known.
Inspect the conversion definition
Identify target currency, rate table, date dimension and effective rate type.
Expected observation: Average and Closing are not confused.
Match the maintained row
Compare currency direction, Valid From, type and applicable version/category.
Expected observation: The 10 November Average case selects 1.10 in the fixture.
Compare detail and total
Verify 110 USD and 112 USD separately before checking 222 USD.
Expected observation: Any difference can be assigned to selection or aggregation.
06 Treat rate version as a separate assumption
SAP's currency-table guidance distinguishes rate-version/category context and explains that specific versions use their applicable rates rather than indiscriminately taking generic rows. A Budget scenario can therefore legitimately differ from Actual even when source amount and date match. Record the requested rate context rather than assuming every story uses the same maintained rows. [1]
For a planning comparison, make two explicit scenarios: 100 EUR translated using an illustrative budget rate 1.08 gives 108 USD, while the Average actual-date case gives 110 USD. The 2-USD difference is a rate assumption, not operational cost growth. Present source-currency variance and currency-effect reasoning separately when explaining management totals.
07 Troubleshoot by observed result
A missing conversion and a plausible but wrong number are different failure patterns. The former often suggests an unmatched context; the latter can indicate a different valid row, wrong source currency, another conversion layer or an aggregation choice.
| Observation | Check first | Expected useful evidence |
|---|---|---|
| Blank converted value | Currency/date/type coverage | A matching eligible rate row |
| 115 instead of 110 USD | Closing versus Average | Effective account/measure rate type |
| 112 instead of 110 USD | Relevant date | Model date dimension and fact date |
| 110 in model, another story value | Story calculation/filter | Exact conversion measure and context |
| Correct rows, unexpected total | Conversion/aggregation level | Detail amounts and total semantics |
| All values differ by fixed factor | Direction or scaling | Source currency, rate and display scale |
08 Avoid speculative rate-table repairs
Do not insert overlapping or duplicate rows merely to obtain a desired screenshot. First identify the missing or incorrect context, then change the governed rate data through the normal finance/model process. A shared rate table can affect several models, so verify its consumers before treating it as a private story setting.
SAP documents inverse-rate support in applicable conversion scenarios, but that is not permission to assume every missing currency path will be inferred as you expect. For this tutorial, maintain and test the direct pair explicitly. If the real model relies on inversion or additional conversion behavior, read that release's rules and verify the resulting direction and arithmetic. [1]
09 Verify date boundaries and negative cases
Test 14 November and 15 November with the same 100-EUR Average fact. The fixture expects 110 and 112 USD respectively. Test 31 October without an earlier rate and confirm that the model exposes the missing-conversion condition rather than silently applying a future rate. Test the Closing measure and verify 115 USD independently.
For a negative case, request an unmaintained currency pair or a rate type absent from the table. Capture the actual message or missing-value behavior; do not invent a universal error code. For a boundary in precision, use a nonround amount and compare stored versus displayed decimals under the model's documented rounding behavior. A visual difference of one cent requires detail-level evidence before any rate change.
10 Build a conversion-context worksheet that isolates the wrong selector
Use one row per disputed fact and record both requested and maintained context. For the 10 November cost, write source amount 100, currency EUR, target USD, fact date 10 November, rate type Average, selected table T_ACT and relevant rate-version/category. Next write the actual matching row: EUR, USD, Valid From 1 November, Average,1.10. If someone supplies a 1.15 rate from T_ACT Closing, that row is valid data but does not satisfy this conversion request.
Change one selector at a time in the worksheet. Keep amount 100 fixed and switch only date to 20 November: expected 112. Restore 10 November and switch only type to Closing: expected 115. Restore Average and switch the target to an unmaintained currency: expected missing applicable context rather than an invented conversion. This exercise distinguishes wrong-rate selection from a source-amount defect without modifying a shared finance table.
If the story displays 220 USD for the two 100-EUR facts, divide each detail result by its source amount. Two 110 results suggest both facts used 1.10, which directs attention to date context or a fixed-date conversion. A total 224 with detail 110 and 112 instead suggests that the total calculation is using another context or aggregation rule. Those patterns narrow the investigation but are hypotheses until the actual conversion definition is inspected.
11 Verify the governed rate-table correction across affected measures
Suppose the Average row valid 15 November was accidentally maintained as 1.20 instead of the approved illustrative 1.12. Correcting that row changes the 20 November fact from 120 to 112 USD, a decrease of 8. The 10 November Average result 110 and Closing result 115 should remain unchanged because their contexts select other rows. Include those unchanged controls in the review; otherwise a broad edit to currency pair or type can appear to fix one story while damaging another.
When several models share the table, select representative consumers with the same date/type context and document their expected changes. Retain the source values 100 EUR throughout. This gives finance and analytics owners a compact impact statement: which contexts changed, which controls stayed stable, and whether the story totals now reconcile to the detail. It does not claim that a tenant-wide financial validation was performed.
12 Questions and handover evidence
Why does another report show a different converted amount? Compare model, source versus SAC conversion, date, type, version and total semantics. Can a correct rate table still produce an unexpected value? Yes, if the model selects another context or the source amount is wrong. Does changing a currency symbol perform conversion? No, the amount must be calculated through the intended conversion mechanism.
Close the issue with a reproducible statement: maintenance expense 100 EUR, date 10 November, Average, table T, target USD, rate 1.10, result 110 USD. Include the matching row and the model definition. Continue with dimensions/measures for aggregation design and private/public versions when Budget context changes which planning values are visible.
Related services and next steps
Primary sources
Found this useful?
Share this guide with your network, or leave a like.
Your like is saved in this browser.