SAP Analytics Cloud dimensions versus measures: Categories and values
A manufacturer analyzes production quantities and costs by plant, product and period and must distinguish descriptive dimensions from numeric measures.

Source review:
START HERE · NO PRIOR TOPIC KNOWLEDGE NEEDED
What it is. Why it matters.
A measure is a value such as revenue or quantity. A dimension describes how to group it, such as product or month, making a number meaningful in a report.
Completely new to SAP?
Manufacturers use SAP to connect work such as buying components, recording inventory, planning production, shipping equipment and accounting for costs. SAP S/4HANA is an enterprise resource planning system: it connects these activities through shared business data.
Analytics organizes business data into useful comparisons. Planning adds proposed future values. Learn what the numbers represent before comparing totals or changing a forecast.
A transaction code, or t-code, is a shortcut to a task in classic SAP GUI. Fiori apps provide another way to work. Names and screens depend on the product and release; you do not need a live system to learn the concepts in this guide.

Scope and source-review notes
Scope and evidence
Source review by FAST SAP SOLUTIONS® editorial. This badge describes our editorial review; it does not represent SAP certification or independent endorsement.
SAP Analytics Cloud acquired standard-model concepts with multiple measures. Classic account models represent structure differently; live models inherit important semantics from their source.
Documentation review on 14 November 2026 used the official SAP sources listed below, including indexed excerpts where full text was unavailable. Scope and availability depend on the stated product, release and configuration. All document references, quantities, dates and outcomes in worked cases are illustrative; no customer SAP system or tenant was accessed and the proposed exercises were not executed.
A MANUFACTURING EXAMPLE
Build a meaningful manufacturing performance view
Calculate weighted production yield
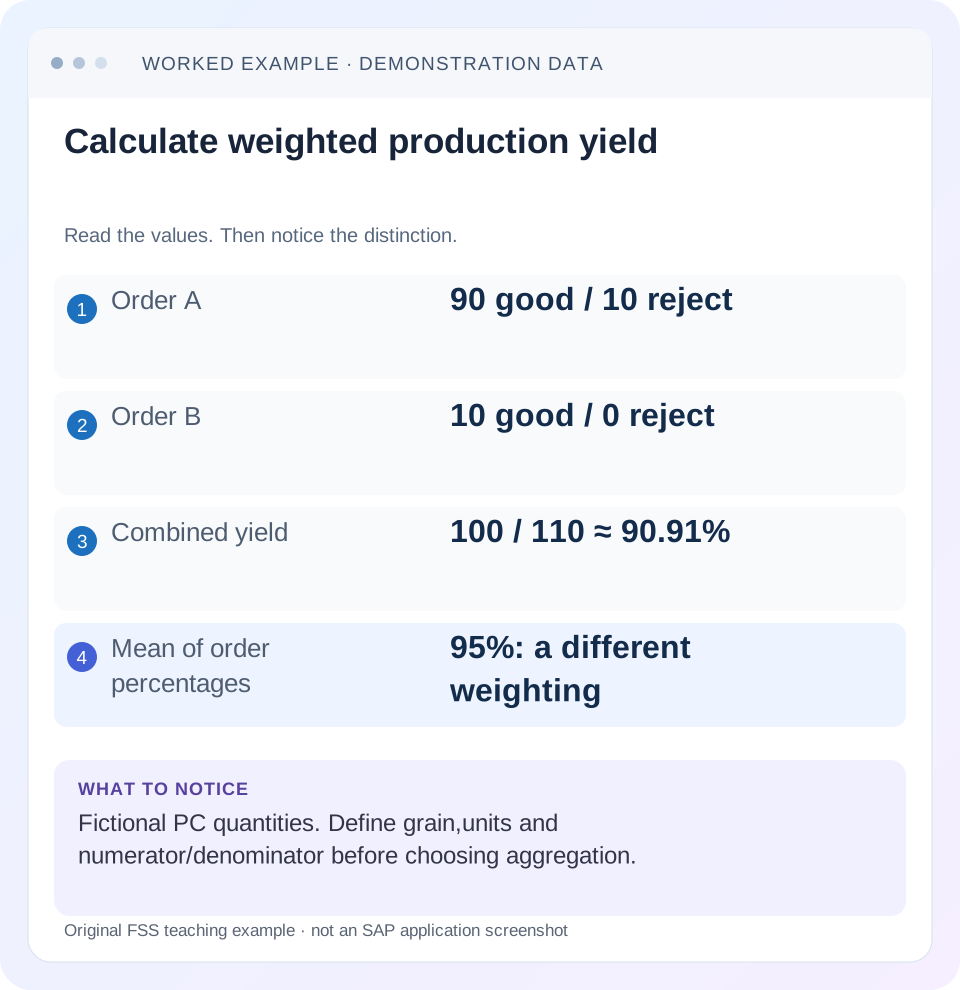
Read the example values
- Order A
- 90 good / 10 reject
- Order B
- 10 good / 0 reject
- Combined yield
- 100 / 110 ≈ 90.91%
- Mean of order percentages
- 95%: a different weighting
Words you’ll meet in this guide
- Dimension
- A way to group data, such as month or product.
- Measure
- A numeric value, such as revenue or quantity.
- Model
- A defined organization of data and calculation rules.
- SAC
- SAP Analytics Cloud: a cloud application for analytics and planning.
Preview the practical steps
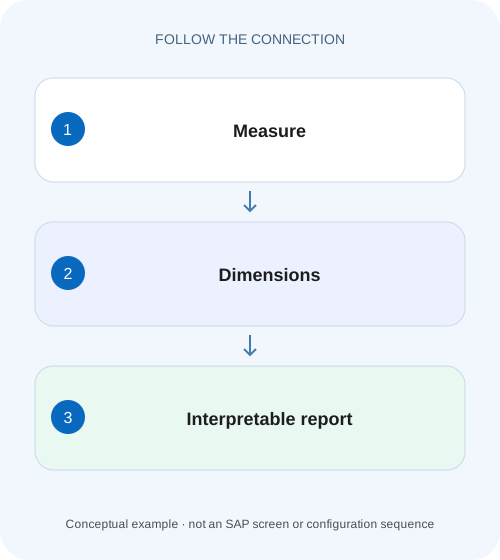
SEE THE CONNECTION
See it in a simple example.
A small example to make the idea concrete.
Build a meaningful manufacturing performance view
A manufacturer analyzes production quantities and costs by plant, product and period and must distinguish descriptive dimensions from numeric measures.
Decide what describes a fact and what is measured
A dimension supplies the categories that identify or describe a fact: plant, material, date, production order or planning version.
Define the grain before importing columns
The grain says what one source row means.
Understand members, properties and hierarchies
A dimension member has an identity and can have a description and properties.
Build a meaningful manufacturing performance view
A manufacturer analyzes production quantities and costs by plant, product and period and must distinguish descriptive dimensions from numeric measures.
Check the measure's aggregation and units alongside the chosen dimensions before comparing totals.
| Reader | Business question | Evidence to carry forward |
|---|---|---|
| SAP developers and application teams supporting manufacturers | Build a meaningful manufacturing performance view | Check the measure's aggregation and units alongside the chosen dimensions before comparing totals. |
01 Decide what describes a fact and what is measured
A dimension supplies the categories that identify or describe a fact: plant, material, date, production order or planning version. A measure supplies a numeric value whose unit and aggregation have business meaning: produced quantity, rejected quantity or cost. Numeric appearance alone does not make a field a measure. Material 1000123 is an identifier; adding it to material 1000124 has no useful business interpretation.
This tutorial is for SAC analysts preparing an acquired model and report designers checking totals. You need a small source dataset, a stated business grain and known units. It uses a standard model with several measures. In a classic account model, an account dimension and default measure can represent values differently; do not copy these structural decisions into every model type without checking its design.
02 Define the grain before importing columns
The grain says what one source row means. In the worked example, one row is one production order's daily completion at a plant. Plant, order and date identify that fact. Material describes it. Good quantity, reject quantity and production cost are measures. This definition lets you decide whether a repeated source row is an additional event or an accidental duplicate.
If the source instead contains one row per component movement, an order's finished quantity may repeat across many rows. Summing it would overstate production. A field can be numeric and still be unsuitable for sum at the imported grain. Resolve source joins and grain before trying to repair the chart with a formatting choice.
03 Understand members, properties and hierarchies
A dimension member has an identity and can have a description and properties. Plant 1000 may be described as North Works and belong to a region hierarchy. A property's purpose is to describe members; it should not create a second independent copy of every transaction merely to display a label. Preserve stable member IDs when descriptions change.
SAP's modeler documentation describes adding and editing dimensions and measures, and warns that the interface depends on model configuration. It also supports reusing public dimensions in applicable models. Reuse is useful when plant IDs and hierarchies must remain consistent across cost and production models, but reuse requires agreement about what the member means, not just a matching label. [1]
04 Work a production-yield dataset
Use two illustrative orders at the same plant and date. Order A produces 90 good pieces and 10 rejects, costing 1,000 EUR. Order B produces 10 good pieces and 0 rejects, costing 200 EUR. Total produced is 100 for A and 10 for B. The combined good quantity is 100 and combined produced quantity 110.
The simple average of the order percentages is 95%, which gives the two orders equal weight despite their different volumes. For volume-weighted yield, the desired calculation is total good divided by total produced: 100/110. Decide which question the metric answers before configuring its aggregation. Neither the percent sign nor a measure name automatically supplies the correct business formula.
| Order | Good PC | Reject PC | Cost EUR | Good / produced |
|---|---|---|---|---|
| A | 90 | 10 | 1,000 | 90 /100 =90% |
| B | 10 | 0 | 200 | 10 /10 =100% |
| Combined | 100 | 10 | 1,200 | 100 /110 ≈90.91% |
05 Configure units and aggregation deliberately
Good and reject quantities can be summed when the rows share a comparable unit and nonoverlapping event grain. EUR cost can be summed for the same currency context. A rate, percentage, unit price or stock snapshot usually needs further reasoning. A daily closing-stock measure summed across dates answers a different question from end-of-month stock.
Do not combine 10 PC and 10 KG as 20 “quantity” without a documented conversion or separate treatment. Similarly,1,000 EUR plus 1,000 USD is not 2,000 EUR. Unit and currency semantics belong with the measure. For this dataset, keep PC and EUR explicit in the source contract and model design, then use conversion where required rather than changing the display label.
06 Build and inspect a minimal model
Start with the detail table before a dashboard. Include every identifying dimension and each base measure. Check member identity and raw values, then remove dimensions one at a time and predict the aggregation. This reveals modeling problems earlier than a polished total card.
Inspect the imported schema
Classify plant, order, date and material as context; identify numeric measures and units.
Expected observation: Order IDs are not summed.
Validate the source grain
Confirm A and B occur once in the intended daily completion population.
Expected observation: Production is not multiplied by component-detail joins.
Check base totals
Sum good 100, reject 10 and cost 1,200 EUR.
Expected observation: Base measures match the fixture.
Check the derived metric
Calculate 100 divided by 110 for combined yield.
Expected observation: The report shows about 90.91% at the chosen precision.
07 Diagnose a total that looks wrong
Different wrong totals point to different design defects. A quantity doubled exactly after adding a descriptive field can indicate a join/grain problem. A correct total with an unfamiliar abbreviation can be display scaling. A percentage that changes unexpectedly when removing order can be aggregation semantics rather than missing data.
| Observation | Question | Next check |
|---|---|---|
| Material IDs appear as a sum | Identifier modeled as value? | Field type and source mapping |
| Good quantity multiplied | Repeated fact at lower grain? | Source row identities and joins |
| Yield 95% instead of 90.91% | Average of ratios? | Aggregate numerator/denominator |
| Cost mixes EUR andUSD | Currency context missing? | Base measure currency and conversion |
| 92.62M appears unexpected | Scaling or wrong raw amount? | Stored value and display scale |
| Same plant label twice | Different member IDs? | IDs, descriptions and hierarchy |
08 Keep transformations separate from presentation
A chart label can clarify a measure, but it cannot correct a duplicated fact. Filtering a duplicate source row in one story may hide the symptom while other consumers still overstate production. Correct the import/transformation or model grain when that is where the defect originates, and then recheck the dependent stories.
SAP's dimension-editing guidance calls out dependencies such as stories and data actions when model structure changes. Treat deleting or replacing a dimension as a model change with consumers to review. A field unused in the current chart may still participate in planning logic, security or another report. Inspect dependencies before removing it for convenience. [1]
09 Verify positive, negative and zero-denominator cases
The positive test reproduces A, B and combined totals. A negative test imports a duplicate A row and demonstrates why the base totals would become 190 good,20 rejects and 2,200 EUR unless the design prevents or deliberately handles duplication. This is a fixture for detecting incorrect grain, not an instruction to deduplicate every repeated-looking business event.
For a boundary case, include an order with zero good and zero rejects. Define the intended yield behavior under the model's supported calculation semantics: blank, undefined or another agreed representation. Do not present zero-denominator output as a normal 0% failure without an explicit business rule. Also test a second unit to ensure incompatible quantities remain distinguishable.
10 Use dimensions to make the metric explainable
A production manager seeing 90.91% should be able to drill into orders A and B and reconcile 100 good out of 110 produced. Plant, material and date dimensions make that explanation possible. A dashboard that supplies only a percentage and no meaningful context is difficult to troubleshoot even if its arithmetic is initially correct.
For a planning model, version is another essential context: Actual and Budget values should not silently aggregate into one operational total. Data access can also change the visible population, so compare totals under the same identity and filters. A user's lower total can be correct for their permitted plants.
11 Map a source file into a model without losing identifiers
Write the source schema explicitly: Plant text, Order text, CompletionDate date, GoodQuantity decimal, RejectQuantity decimal, CostAmount decimal, Currency text, and QuantityUnit text. Keep leading zeros in identifiers such as order 000123. If a spreadsheet converts that ID to 123 before import, the model cannot infer that another source's 000123 is the same intended identity without an explicit mapping rule.
Inspect the preview/mapping in the acquired-model preparation flow before loading the full dataset. Confirm that dates were parsed as dates, quantities as measures, and identifiers as categorical context. A source column containing “1,000”can be interpreted differently under locale rules; verify the raw imported value rather than trusting its formatted appearance. Use the two-order fixture to reconcile base quantities immediately after import.
If the source includes both plant and plant description, decide which is the stable ID and which is descriptive metadata. Do not let spelling changes create new analytical plants. North Works renamed to Northern Works should not double the plant's production merely because an import treated the description as a new key.
12 Explain cost per good piece using the same grain
The combined fixture costs 1,200 EUR for 100 good pieces, so cost per good piece is 12 EUR/PC. Averaging order-specific ratios gives another result: order A gives 1,000 / 90 ≈ 11.11 and order B gives 200 / 10 = 20; their simple mean is about 15.56. As with yield, the aggregate ratio must be calculated from its intended numerator and denominator when the question is total cost per total good output.
Include the zero-good case in the metric definition. An order with cost but no good output contributes cost to the total population even though its individual cost-per-good-piece ratio is undefined. Dropping that order solely because the row ratio is blank can understate aggregate cost. Decide population and zero handling before building the report.
13 Questions to settle before publishing the model
Can a number be a dimension? Yes, when it is an identifier or category. Can a measure be nonadditive? Yes, rates and snapshots often require special aggregation reasoning. Is averaging percentages always wrong? No, but it answers an equal-weight question; volume-weighted yield uses the underlying quantities. Should every label become a dimension? Only when its analytical role and data grain justify that structure.
Document the row grain, member identities, units, base aggregation and derived-metric formula alongside the model. Continue with currency conversion for mixed currencies, DAC for user-dependent populations, and live/import connections to distinguish local modeling from source-defined semantics.
Related services and next steps
Primary sources
Found this useful?
Share this guide with your network, or leave a like.
Your like is saved in this browser.