SM50 versus SM66: Find the SAP work process behind a slow request
A factory user reports a slow operational report, but the relevant work process may be on a different application server.

Source review:
START HERE · NO PRIOR TOPIC KNOWLEDGE NEEDED
What it is. Why it matters.
Work processes execute tasks on SAP application servers. SM50 shows an instance’s processes; SM66 provides a broader system view, helping locate work running elsewhere.
Completely new to SAP?
Manufacturers use SAP to connect work such as buying components, recording inventory, planning production, shipping equipment and accounting for costs. SAP S/4HANA is an enterprise resource planning system: it connects these activities through shared business data.
SAP Basis work keeps relevant SAP systems running. Logs, background jobs and connection tools help explain what happened to a task at a particular time.
A transaction code, or t-code, is a shortcut to a task in classic SAP GUI. Fiori apps provide another way to work. Names and screens depend on the product and release; you do not need a live system to learn the concepts in this guide.

Scope and source-review notes
Scope and evidence
Source review by FAST SAP SOLUTIONS® editorial. This badge describes our editorial review; it does not represent SAP certification or independent endorsement.
Classic AS ABAP work-process monitoring for Basis and performance analysts. SM50/SM66 navigation and fields depend on installed release; some releases direct SM66 into the system-wide SM50 view. Administrative cancellation is outside this diagnostic walkthrough.
Documentation review on 14 November 2026 used the available official SAP indexed excerpts; several SAP Help pages returned no readable full text. The worked case and proposed checks are original illustrative teaching material, not execution evidence from a customer SAP system. Exact fields, permitted actions and behavior must be confirmed against the installed product, release and configuration.
A MANUFACTURING EXAMPLE
Investigate a slow plant transaction in the right instance
Local versus system-wide view
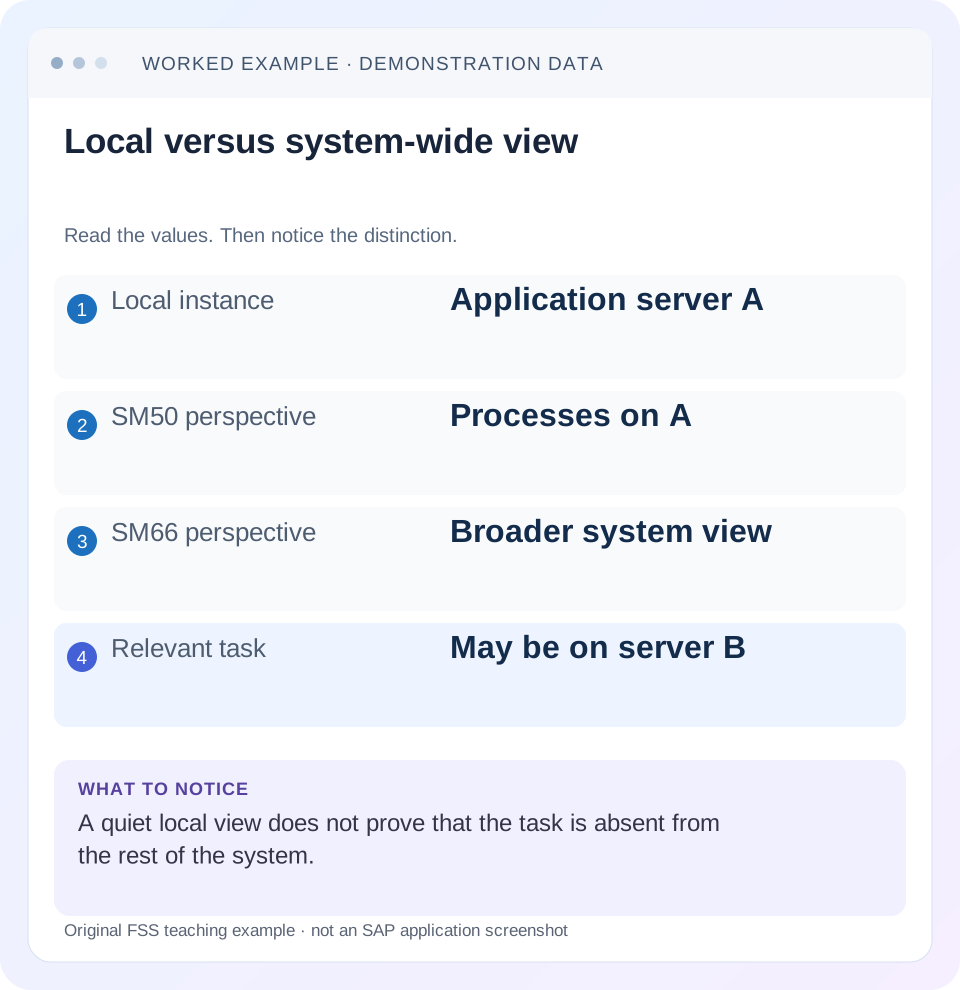
Read the example values
- Local instance
- Application server A
- SM50 perspective
- Processes on A
- SM66 perspective
- Broader system view
- Relevant task
- May be on server B
Words you’ll meet in this guide
- Instance
- A running SAP application-server environment.
- Client
- A logically separate data and configuration context in an ABAP system.
- Log
- A recorded sequence of events and messages.
- ABAP
- SAP’s programming language for business applications.
- SQL
- A language used to read and work with database data.
Preview the practical steps
SEE THE CONNECTION
See it in a simple example.
A small example to make the idea concrete.
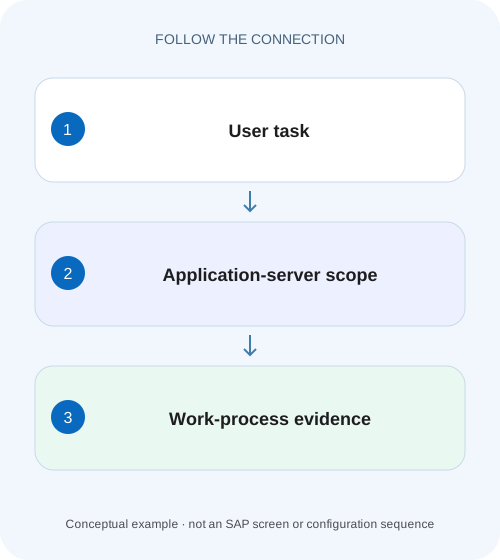
Investigate a slow plant transaction in the right instance
A factory user reports a slow operational report, but the relevant work process may be on a different application server.
Use the view that contains the request
SM50 shows work processes for an application-server instance; SM66 provides a system-wide perspective, or leads into the system-wide SM50 list in relevant releases.
Prerequisites and the unit of investigation
This tutorial is for permitted Basis operators and performance analysts on AS ABAP.
Worked case: a report is slow on server B
In this fictional example, a user starts report ZDEMO_ORDER_LIST at 11:00 in QAS.
Investigate a slow plant transaction in the right instance
A factory user reports a slow operational report, but the relevant work process may be on a different application server.
Compare the local and system-wide process views with the same reproduction before canceling work or attributing the delay to one server.
| Reader | Business question | Evidence to carry forward |
|---|---|---|
| SAP developers and application teams supporting manufacturers | Investigate a slow plant transaction in the right instance | Compare the local and system-wide process views with the same reproduction before canceling work or attributing the delay to one server. |
01 Use the view that contains the request
SM50 shows work processes for an application-server instance; SM66 provides a system-wide perspective, or leads into the system-wide SM50 list in relevant releases. Start by locating the request's instance. A quiet local server cannot disprove work on another server. [1] [2]
SAP describes the overview as a snapshot of process state. A snapshot helps answer which process is handling work now. It does not, by itself, explain the whole execution history, prove an application loop or establish that canceling work is safe. Connect the process observation to the user's request before drawing a conclusion. [1]
02 Prerequisites and the unit of investigation
This tutorial is for permitted Basis operators and performance analysts on AS ABAP. Obtain the system, approximate request start, user or job identity and reported action. Use display functions first. The monitor also exposes administrative operations; their availability is separate from whether the incident evidence supports using them.
A work process is an execution resource, while a user request or background job is a unit of work. One process can handle different requests over time, and a multi-step business action can produce several executions. Therefore, a process number without an observation time, instance and request context is not a durable business identifier.
03 Worked case: a report is slow on server B
In this fictional example, a user starts report ZDEMO_ORDER_LIST at 11:00 in QAS. The analyst is logged into server A. A local SM50 snapshot shows mostly idle dialog processes. The user's session information and the system-wide view point to server B, where a dialog process is executing the report for the expected user.
At 11:01 and 11:02 the same process context remains associated with the request. At 11:03 it finishes. This establishes a long-running execution relative to the user's expectation, not a permanently stuck process. The next question is where time was spent and whether the report's selection and volume explain it.
| Time | Scope | Observation |
|---|---|---|
| 11:01 | A local view | No matching report |
| 11:01 | System-wide view | Report found on B |
| 11:02 | B process context | Same request still executing |
| 11:03 | B and user result | Request completed |
04 Record a process identity that can be correlated
Capture observation time, instance, work-process number or identifier, type, operating-system process identifier where shown, status and the permitted user/program/action context. Include only incident-relevant identifiers. A process number such as 7 can exist on several instances; the server is part of its identity.
Compare the request start and context with the user's action. A similarly named program under another user may be unrelated. An operating-system PID helps correlate host observations but can change after process restart, so retain time boundaries. Avoid treating a later observation of the same process slot as proof that the original request is still there.
05 Read status in its documented context
A waiting or idle process can be available to accept work rather than blocked by a business lock. A running process can be executing useful computation. A hold or wait reason needs its own documented interpretation. SAP's detailed process overview documents fields such as hold reason and semaphore information; labels vary across releases. [3]
Read type, status, action and reason together. A long elapsed runtime does not mean high CPU consumption throughout that interval. The request may wait on a database, remote call or resource dependency. Conversely, repeated active observations do not prove a loop; the program might be processing a large legitimate dataset.
06 Take a second observation with a defined question
Repeat a permitted display after a suitable short interval to ask whether the same request is still active and whether its action has changed. Record both snapshots rather than overwriting the first. A change from one database operation to another suggests progress, although it says nothing yet about whether that progress is efficient.
For the worked report, compare the selected customer/date range and expected result size with the request context. If the user accidentally selected a year instead of a day, the program may be doing more work than intended. That finding is distinct from a code defect, though the design may still need better selection validation.
07 Separate background processes from scheduled jobs
If the relevant process type is background, identify the corresponding job and step through the supported job monitor. SM37 provides the job's scheduling and execution context, log and spool relationships. A process screenshot does not establish which job instance ran or whether earlier steps completed.
A job can wait for a start condition before consuming any background work process. In that state, searching active processes will not explain its scheduling delay. Conversely, an active background process can belong to a different job from the one reported. Match job name, execution identity, time and program rather than relying on a similar report name.
08 Choose the next measurement from the observed layer
For a completed slow dialog execution, STAD can provide the relevant statistical record if retained. ST03N helps establish whether the transaction is broadly slow or only a small subset is affected. A database-heavy timing pattern can justify a targeted SQL investigation, while host-resource correlation may justify ST06 review.
SM50 itself is not a substitute for a measured trace of the relevant code or SQL. Use the smallest diagnostic scope that can answer the next question and the appropriate authorized tool. The handoff should say which request was observed and which hypothesis needs testing, rather than asking a developer to optimize whichever program happened to be visible.
09 Why cancellation needs business reconciliation
An apparent hang can tempt an operator to cancel the top runtime entry. Before any authorized cancellation decision, identify the business process, possible updates and external effects, plus the consequences of interrupting it. A monitor status cannot tell you that everything will roll back across all dependencies.
If a cancellation is approved under an incident procedure, capture the pre-action evidence and reconcile the actual outcome afterward. An interrupted interface might have sent data remotely even if the caller did not receive confirmation. An interrupted report may have created output or partially completed independent work. Repeating it safely depends on those facts.
10 Troubleshoot the common observation gaps
If the user reports slowness but no matching process appears, the request may have finished, be waiting outside active execution, run on another server or use a different technical identity. Check timing and route rather than concluding that the user is mistaken. If a process remains visible, compare context across observations before assigning continuity.
If all dialog resources appear busy, inspect the duration and workload mix and correlate dispatcher/workload evidence through the normal operations procedure. Adding capacity or changing process counts is a separate design decision. One crowded snapshot cannot establish a permanent capacity shortage or the correct parameter value.
| Observation | Check next |
|---|---|
| No match locally | System-wide scope and session instance |
| Same slot, different context | Request continuity and timestamp |
| Background process identified | SM37 job instance and step |
| Long runtime, low host CPU | Timing components and dependency waits |
| All resources briefly busy | Duration, workload mix and queue evidence |
11 Practice positive, negative and boundary checks
A positive training check locates a known harmless report on its actual server and matches its user/program context. A negative check looks only at A while the fixture's report runs on B; the analyst should explicitly report the scope limitation. A boundary check samples after the request finishes and uses retained statistics rather than expecting a live process.
Another useful exercise gives two snapshots with the same process number but different users and programs. The correct conclusion is that the slot was reused, not that one request changed ownership. These checks teach identity and timing without requiring cancellation, debug attachment or resource-intensive test reports.
12 Build a two-snapshot comparison before escalating
For the report example, write two observation rows containing server B, process slot, PID if displayed, user, program, status, action and time. Compare every identity field before describing the rows as one continuing request. If the program context changes while the user and request remain consistent, retain both actions as potential progress evidence. If user or PID changes, investigate reuse or restart rather than extending the original runtime arbitrarily.
Pair those observations with the user selection: January through December versus one requested day, plus the expected result volume. Ask for a comparable retained execution record when the request completes. A useful escalation can then distinguish excessive selected work, expensive execution per unit of work and delay waiting for a dependency. Those are different optimization problems, and the same top-runtime screenshot cannot resolve all three.
A useful timing boundary is an illustrative request with 180 seconds elapsed but 15 seconds of measured CPU in a compatible execution record. It is wrong to call all 180 seconds CPU computation. It is also wrong to label the remaining 165 seconds as a particular wait category without the documented component evidence. Use the work-process action and retained timing fields to locate the next measurement. This example gives a developer a precise distinction between doing more computation and waiting longer for another resource, while preserving the possibility that several causes contribute to one long execution.
13 Questions and a useful final handoff
Is the longest runtime always the problem? No. It may be a planned batch or a legitimately large selection. Does an idle local SM50 prove spare capacity across the system? No. The request's instance and the relevant process pool matter. Does a process in hold automatically mean an SM12 lock? No. Read the documented reason and correlate the dependency.
A useful result reads: “QAS B, dialog process 7, user DEMO_U, ZDEMO_ORDER_LIST observed 11:01–11:02; completed 11:03. Selection covered twelve months. Need retained execution timings and comparable one-day selection.” That evidence gives the next analyst a specific workload question while keeping the illustrative observations separate from a proven performance diagnosis.
Related services and next steps
Primary sources
Found this useful?
Share this guide with your network, or leave a like.
Your like is saved in this browser.