SAP ST06: Separate host-resource evidence from an application guess
A manufacturing report slows when another batch workload overlaps, and support needs host-level evidence for the same interval.

Source review:
START HERE · NO PRIOR TOPIC KNOWLEDGE NEEDED
What it is. Why it matters.
The operating system manages the computer running SAP. ST06 exposes host-resource information such as CPU and memory, helping separate host pressure from application-specific problems.
Completely new to SAP?
Manufacturers use SAP to connect work such as buying components, recording inventory, planning production, shipping equipment and accounting for costs. SAP S/4HANA is an enterprise resource planning system: it connects these activities through shared business data.
SAP Basis work keeps relevant SAP systems running. Logs, background jobs and connection tools help explain what happened to a task at a particular time.
A transaction code, or t-code, is a shortcut to a task in classic SAP GUI. Fiori apps provide another way to work. Names and screens depend on the product and release; you do not need a live system to learn the concepts in this guide.

Scope and source-review notes
Scope and evidence
Source review by FAST SAP SOLUTIONS® editorial. This badge describes our editorial review; it does not represent SAP certification or independent endorsement.
ST06/operating-system monitor concepts for applicable ABAP landscapes. Metrics and historical views depend on operating system, virtualization, collector and release. Examples do not prescribe universal thresholds or host sizing.
Documentation review on 14 November 2026 used the available official SAP indexed excerpts; several SAP Help pages returned no readable full text. The worked case and proposed checks are original illustrative teaching material, not execution evidence from a customer SAP system. Exact fields, permitted actions and behavior must be confirmed against the installed product, release and configuration.
A MANUFACTURING EXAMPLE
Correlate a plant report delay with host load
Use the affected host
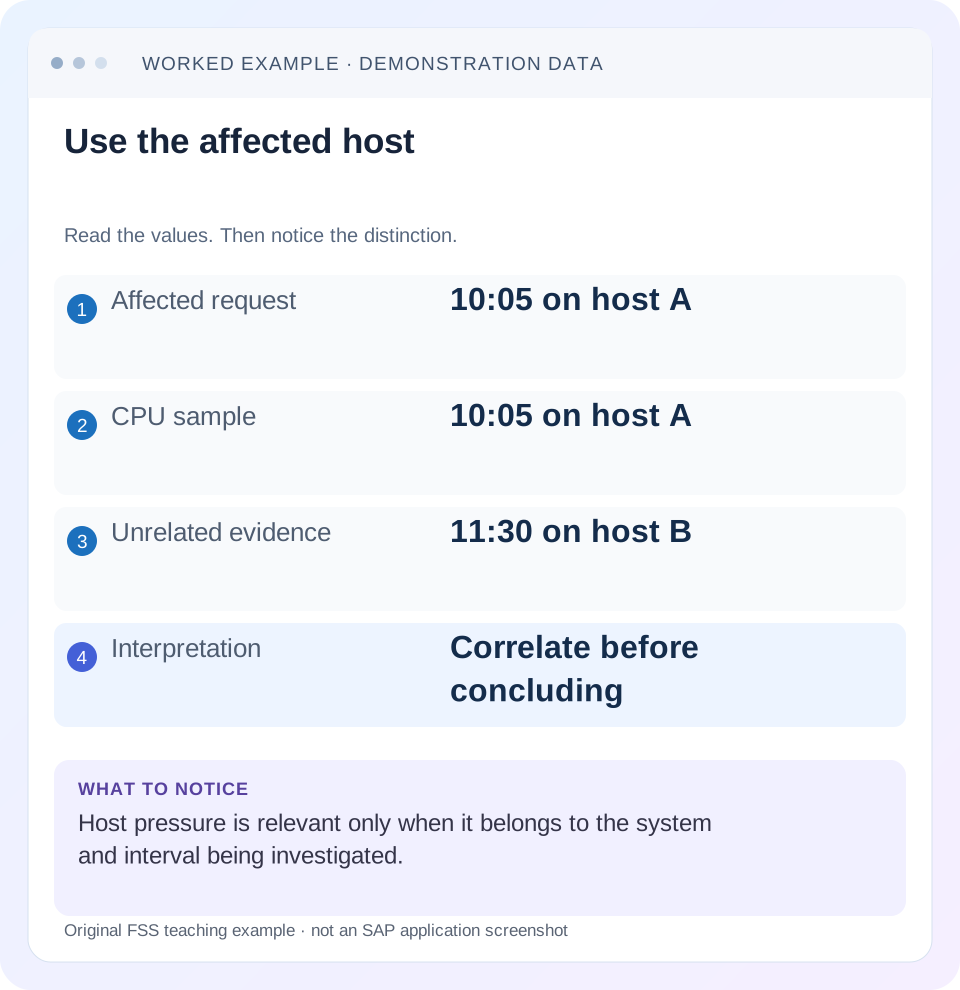
Read the example values
- Affected request
- 10:05 on host A
- CPU sample
- 10:05 on host A
- Unrelated evidence
- 11:30 on host B
- Interpretation
- Correlate before concluding
Words you’ll meet in this guide
- Instance
- A running SAP application-server environment.
- Client
- A logically separate data and configuration context in an ABAP system.
- Log
- A recorded sequence of events and messages.
- ABAP
- SAP’s programming language for business applications.
- HTTP
- The request-and-response protocol used by web applications and APIs.
- SQL
- A language used to read and work with database data.
Preview the practical steps
SEE THE CONNECTION
See it in a simple example.
A small example to make the idea concrete.
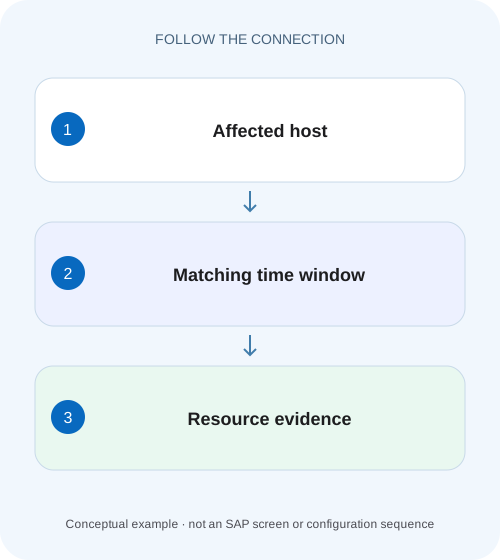
Correlate a plant report delay with host load
A manufacturing report slows when another batch workload overlaps, and support needs host-level evidence for the same interval.
Match host resources to the affected request
ST06 helps inspect operating-system resources for the relevant host.
What the analyst needs
This tutorial is for Basis and performance analysts with permitted monitor access.
Worked case: a report slows during a batch overlap
In a fictional QAS landscape, instance B runs on host APP-B.
Correlate a plant report delay with host load
A manufacturing report slows when another batch workload overlaps, and support needs host-level evidence for the same interval.
Align operating-system observations and workload timing before attributing the delay to an ABAP statement alone.
| Reader | Business question | Evidence to carry forward |
|---|---|---|
| SAP developers and application teams supporting manufacturers | Correlate a plant report delay with host load | Align operating-system observations and workload timing before attributing the delay to an ABAP statement alone. |
01 Match host resources to the affected request
ST06 helps inspect operating-system resources for the relevant host. Begin by identifying the application server handling the request and the host on which it runs. A CPU chart from another host or a quiet snapshot taken after the incident cannot establish the resource conditions that affected the user.
SAP documents CPU and memory categories and related operating-system monitoring. These observations can establish pressure or correlation. They do not, by themselves, prove an ABAP memory leak, identify an expensive SQL statement or show which business process caused the load. Connect host evidence with application and database evidence at the same time. [1]
02 What the analyst needs
This tutorial is for Basis and performance analysts with permitted monitor access. Obtain the incident interval, time convention, relevant instance-to-host mapping and reported action. Establish whether the host also runs other SAP instances, database services or unrelated workloads. Shared resources mean one instance's symptom may originate elsewhere.
The available metrics depend on operating system, virtualization and the installed monitoring setup. SAPOSCOL documentation explains collection of host data and its use by SAP monitoring. Verify the current collector and view definitions in your landscape. A displayed historical series must have a known sample interval and freshness before it can support a conclusion. [2]
03 Worked case: a report slows during a batch overlap
In a fictional QAS landscape, instance B runs on host APP-B. Users report a normally short read-only report taking much longer between 08:00 and 08:20. A large scheduled batch also starts at 08:00. Host CPU utilization is high through that interval, while the 09:00 current view looks quiet.
The overlap is a hypothesis-generating observation, not proof that the batch caused the report delay. The batch may run on another host, the report may select more data or a shared database may be the bottleneck. The investigation must confirm host placement, duration and the actual workload timing before selecting a correction.
| Interval | Application observation | Host context |
|---|---|---|
| 08:00–08:20 | Batch and reported delays | Review APP-B history |
| 08:05–08:17 | Report execution | Twelve-minute overlap |
| 09:00 | Current view quiet | Does not refute earlier pressure |
04 Check freshness and collection coverage first
Record the selected host, last update or available freshness indicator, historical period and sample interval. If the collector is stopped or values are stale, do not interpret the last recorded low utilization as current spare capacity. Report the collection gap and restore monitoring through the responsible operational procedure.
When comparing charts, use compatible time bases. A one-minute peak and a one-hour average can look very different while describing the same event. Preserve the aggregation interval alongside each value. If the incident lasts two minutes, an hourly summary can conceal it; if the complaint lasts an hour, one isolated spike may be irrelevant.
05 Read CPU as duration and workload context
Look at how long utilization remains high and whether the affected requests overlap. A brief peak during successful processing can be normal. Sustained pressure aligned with delayed work is more useful evidence, particularly when process-level observations show which workload consumes CPU.
CPU metrics vary by operating system and virtualization. Interpret user/system/idle or other displayed categories using the installed documentation. Do not translate a high host percentage into “ABAP is looping” without process and execution evidence. On a shared or virtualized host, effective resource availability and other workloads can affect application response even when the ABAP code is unchanged.
06 Separate memory occupancy from active paging pressure
Low free memory alone is not a universal memory-shortage diagnosis; operating systems use memory for caches and other purposes. Inspect the documented available/used measures and paging or swap activity over the incident period, keeping units and directions clear. SAP's memory-monitor documentation distinguishes physical memory, swap space and paging activity. [3]
Also separate allocated swap space from current page-in/page-out rates. A historical allocation can persist after pressure subsides. A rate expressed in pages per second cannot be compared directly with a quantity in kilobytes without the relevant conversion. The useful question is whether active memory movement and workload timing support a pressure hypothesis during the complaint.
07 Inspect I/O and network when the symptom points there
CPU can be quiet while a request waits for storage, network or a remote system. Use the appropriate available host-resource category and correlate it with the application's waiting evidence. A quiet CPU chart does not prove that the host or the route is uninvolved.
For a report dominated by database time, distinguish the application host from the database host. APP-B's disk chart may not describe the storage used by the database. Similarly, a remote HTTP delay can occur beyond APP-B's local network interface. Follow the relevant dependency and its own host or service evidence rather than treating one ST06 screen as whole-landscape coverage.
08 Correlate processes, jobs and execution statistics
Locate the affected work through SM50/SM66 while active, or use retained STAD/ST03N evidence for completed executions. If a scheduled batch is implicated, identify its exact SM37 run and execution host. A familiar job name is insufficient when several instances or repeated runs exist.
For the worked case, assemble a timeline with report start/end, batch start/end and APP-B resource samples. If the batch actually ran on APP-A, its direct CPU competition on APP-B is disproved, though shared dependencies may still matter. If both ran on APP-B, compare process consumption and the report's timing components before attributing causation.
09 Build a controlled operational hypothesis
Suppose the evidence shows a CPU-heavy approved batch on APP-B and the report becomes slow only during its sustained execution. A candidate operational change might adjust scheduling or placement within the supported design. The prediction should be explicit: comparable report requests should experience less delay during the revised overlap pattern.
Capacity changes require broader evidence about sustained demand, workload growth and other resources. Do not resize based on one incident screenshot. A scheduling change can also move impact to another process, so verify dependent jobs, deadlines and host utilization across the relevant interval. The smallest effective correction still needs a complete business timing check.
10 Troubleshoot common mismatches
If the user is slow but the host looks quiet, check the incident period, sampling, request placement and external dependencies. If CPU is high but users are fine, identify the planned workload and whether service targets are actually breached. If memory appears full without active paging, investigate the OS's memory definitions before calling it exhaustion.
If two monitors disagree, compare units, aggregation intervals, host identity and data freshness. One may report instantaneous consumption and another an averaged rate. Do not select whichever number best supports the initial theory. Reconcile the measurement definitions and retain the unresolved gap when the available evidence cannot settle it.
| Observation | Next check |
|---|---|
| Unexpectedly static values | Collector freshness and sample coverage |
| High CPU during incident | Process workload and request timing |
| Low free memory | Available memory definition and active paging |
| Quiet application host | Database, network or remote dependency |
| Different charts disagree | Host, units and aggregation interval |
11 Verify positive, negative and boundary cases
A positive learning check aligns the report delay, batch execution and APP-B pressure in the fictional 08:00–08:20 window. A negative check substitutes a 09:00 chart: the correct conclusion is that it cannot refute the earlier incident. A boundary check uses stale collector data and requires the analyst to report missing current evidence.
After an approved correction, compare equivalent report inputs and relevant workload periods. Record response timing as well as resource behavior. Include the batch's completion and downstream deadlines so improved dialog response does not hide a broken background process. State observed sample size and conditions; do not turn one faster repeat into a universal performance claim.
12 Calculate a simple overlap measure
If the report runs from 08:05 to 08:17 and the batch from 08:00 to 08:20, their illustrative overlap is twelve minutes. If a revised batch starts at 08:15 while the report still runs 08:05–08:17, overlap is two minutes. That arithmetic describes concurrency, not a predicted ten-minute performance improvement.
Use such calculations to define the comparison rather than to manufacture a benefit estimate. The report may still wait on the database or an external dependency. Only measured equivalent runs can establish the response change, and the host chart must show whether the resource condition changed as predicted.
For APP-B, prepare a resource worksheet with one row per available sample and columns for sample interval, CPU categories, relevant memory/paging measure and concurrent job context. Add the report start and completion as timeline markers. The worksheet lets another analyst see whether high consumption precedes, overlaps or follows the delay. A peak after the report completes cannot explain its earlier wait without additional evidence.
Now remove the batch from the paper fixture while leaving the host chart unchanged. The analyst should ask what other workload produced that consumption, rather than preserving the original batch explanation. This exercise tests a practical causal boundary: a resource symptom belongs to a host and interval; attribution requires the process or workload that actually used it.
A useful virtualization handoff states whether the chart describes the guest host’s visible resources or another infrastructure scope. Do not compare a guest CPU percentage with a physical-host percentage as if they shared one denominator. Similarly, identify whether a memory figure is a current sample, an average or a peak. For the APP-B incident, the analyst should preserve those definitions with the chart before infrastructure teams compare it with their own monitoring. A difference in scope can explain apparently contradictory numbers without proving that either collector is wrong or that the report code changed.
13 Questions and a useful resource handoff
Does high CPU prove a defect? No; it can represent productive work. Does low CPU prove no bottleneck? No; waiting can dominate. Does ST06 identify the responsible SQL statement? It supplies host context; statement-level evidence requires the appropriate database/application analysis.
A useful handoff names host APP-B, 08:00–08:20, metric definitions and sample interval, affected instance/request and the correlated job run. State what is observed and what remains a hypothesis. Continue with workload, work-process and job lessons to connect the infrastructure pattern to a specific execution and a measurable corrective action.
Related services and next steps
Primary sources
Found this useful?
Share this guide with your network, or leave a like.
Your like is saved in this browser.