SAP Cloud ALM health versus integration monitoring: Route the alert to the right owner
A manufacturer's monitored system appears healthy while an individual supplier invoice integration is rejected.

Source review:
START HERE · NO PRIOR TOPIC KNOWLEDGE NEEDED
What it is. Why it matters.
SAP Cloud ALM monitors supported cloud operations. Health monitoring examines service condition; integration monitoring follows message or process exchanges between systems.
Completely new to SAP?
Manufacturers use SAP to connect work such as buying components, recording inventory, planning production, shipping equipment and accounting for costs. SAP S/4HANA is an enterprise resource planning system: it connects these activities through shared business data.
Migration moves business data into a target system. Lifecycle management controls how software or configuration changes move between environments; both need evidence of the target result.
A transaction code, or t-code, is a shortcut to a task in classic SAP GUI. Fiori apps provide another way to work. Names and screens depend on the product and release; you do not need a live system to learn the concepts in this guide.

Scope and source-review notes
Scope and evidence
Source review by FAST SAP SOLUTIONS® editorial. This badge describes our editorial review; it does not represent SAP certification or independent endorsement.
SAP Cloud ALM Health Monitoring and Integration & Exception Monitoring concepts. Available metrics, categories and managed-component onboarding vary by service.
Documentation review on 14 November 2026 using official SAP sources and indexed official excerpts where full Help text was unavailable. Scope and service or release differences are explained in the lesson. All datasets, requests and checks are illustrative; no customer SAP runtime execution or measured results are claimed.
A MANUFACTURING EXAMPLE
Separate system health from a supplier-message failure
Healthy service, failed message
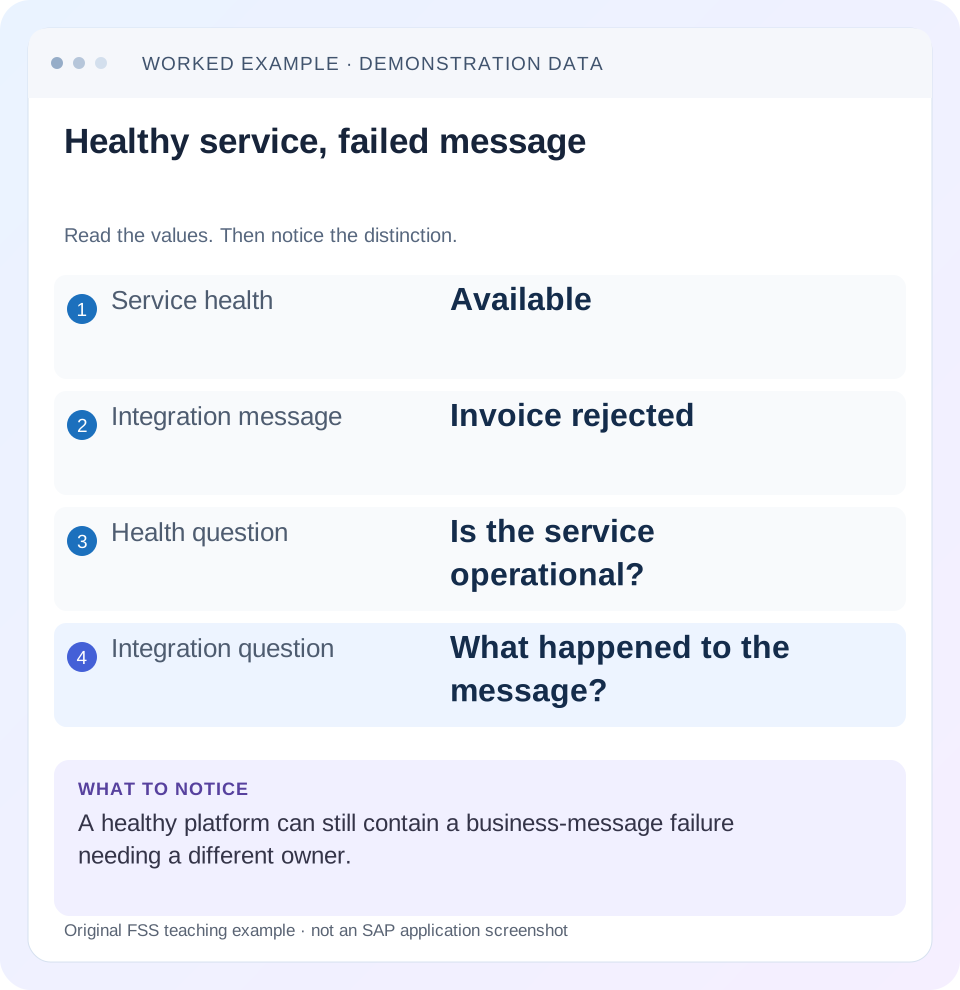
Read the example values
- Service health
- Available
- Integration message
- Invoice rejected
- Health question
- Is the service operational?
- Integration question
- What happened to the message?
Words you’ll meet in this guide
- Source
- The system or dataset information comes from.
- Target
- The destination system or dataset.
- Validation
- A check that information meets required rules.
Preview the practical steps
SEE THE CONNECTION
See it in a simple example.
A small example to make the idea concrete.
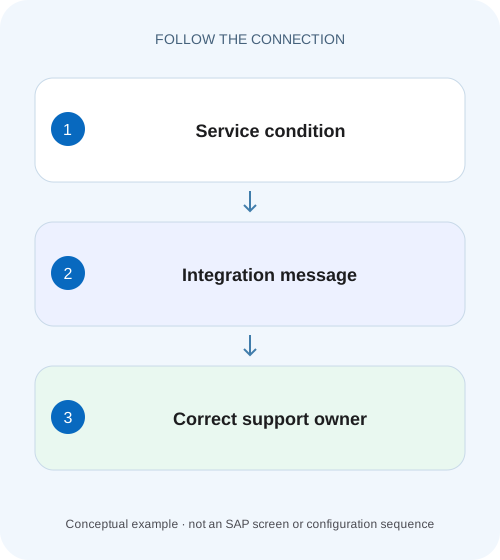
Separate system health from a supplier-message failure
A manufacturer's monitored system appears healthy while an individual supplier invoice integration is rejected.
Use health evidence for component condition and integration evidence for exchanges
A healthy service can still reject one invoice or fail a particular integration message.
Understand what each monitoring view can establish
Health Monitoring observes configured health metrics for managed components and can produce events/reactions when their conditions require attention.
Worked case: health is green, invoice EXT-900 is rejected
Imagine a monitored integration service showing its configured health checks as healthy during 10:00–10:10.
Separate system health from a supplier-message failure
A manufacturer's monitored system appears healthy while an individual supplier invoice integration is rejected.
Follow message-level business evidence alongside health observations before declaring the operational process successful.
| Reader | Business question | Evidence to carry forward |
|---|---|---|
| SAP developers and application teams supporting manufacturers | Separate system health from a supplier-message failure | Follow message-level business evidence alongside health observations before declaring the operational process successful. |
01 Use health evidence for component condition and integration evidence for exchanges
A healthy service can still reject one invoice or fail a particular integration message. SAP Cloud ALM Health Monitoring and Integration & Exception Monitoring answer different questions. Start from the business impact, then inspect the configured component metrics and the specific message/exception path. A green health overview does not override an explicit business rejection. [1]
This tutorial is for operations analysts and integration/application owners using SAP Cloud ALM. You need authorized monitoring access, managed-component identity, selected scope/time and a message or business reference. Metrics, categories, collection and detail access depend on supported managed services and onboarding. This lesson does not assume every service exposes the same metrics or message fields.
02 Understand what each monitoring view can establish
Health Monitoring observes configured health metrics for managed components and can produce events/reactions when their conditions require attention. Integration & Exception Monitoring follows collected messages, exceptions and relevant sequences within its supported scope. Neither is an omniscient record of every business action across an unconfigured landscape. [1] [2]
Read each view’s metric/category definition and data freshness. A metric within threshold means the configured observation meets that condition at its observed time. It does not certify all application functions. A message error can identify a business-data problem even when infrastructure metrics remain normal. Conversely, resource or availability trouble can affect many messages without explaining each receiver’s final document outcome.
03 Worked case: health is green, invoice EXT-900 is rejected
Imagine a monitored integration service showing its configured health checks as healthy during 10:00–10:10. At 10:03, invoice EXT-900 is rejected by its receiver because supplier V404 is not valid in the required target context. The infrastructure may be functioning correctly: it received, transported and reported the invalid instruction.
The useful next action is to inspect the message’s business error, mapping and target prerequisite with the application/integration owner. Restarting the service because the invoice failed would not create the required supplier setup. Keep health and message observations together, while using the causal error to choose the corrective work.
| Evidence | Observation | What it means |
|---|---|---|
| Health view | Configured checks healthy at 10:03 | No issue established by those checks |
| Integration message | EXT-900 rejected | This exchange needs investigation |
| Receiver error | Supplier context invalid | Specific application/mapping prerequisite |
| Business result | Intended invoice absent | Outcome still needs controlled recovery |
04 Verify managed-component scope before interpreting an empty list
In Integration & Exception Monitoring, select the managed components relevant to the actual sender, middleware and receiver. SAP documents that the component must already be configured and that messages/exceptions are limited by scope and time frame. An empty view can mean the wrong component, category or period rather than no failure. [2] [3]
For EXT-900, compare the reported system/client or tenant with the component identity in Cloud ALM. Similar names across DEV, QAS and production are not interchangeable. Record the selected component IDs and category with the observation. A production business reference searched in a test component can produce a perfectly accurate but irrelevant empty result.
05 Check collection configuration and freshness as a separate boundary
Confirm the managed service is onboarded for this use case and the relevant collection is active under the supported setup. Then inspect whether monitoring data is current. A configuration entry alone does not prove collection succeeded after a credential change, connectivity issue or managed-service update.
Extend the fixture: the latest collected data is from 09:00, but the invoice failed at 10:03. A query for 10:00–10:10 cannot establish absence of errors until collection for that window is verified. Preserve the actual collection/last-data evidence and inspect the supported collection diagnostics. Do not close the business incident because a stale dashboard is empty.
If the managed service is not supported for the required message category, state that limit and inspect the authoritative source monitoring. Adding a broader time filter cannot manufacture uncollected data.
06 Choose time windows and alert semantics deliberately
Set a time frame covering the reported event and relevant preceding/following attempts, with timezone noted. SAP’s monitoring documentation states that the time selector applies across pages except Alerting, which shows all open alerts in scope. An older open alert can remain visible even when the message period is narrowed. [2]
For EXT-900, a 09:00 alert can therefore remain on the alert page while the message list shows only 10:00–10:10. That is not necessarily a filter defect. Read alert state and scope separately from event time. Acknowledging an alert or changing its display does not correct the underlying invoice or prove a retry succeeded.
07 Correlate the message chain with safe business context
Use the available message/correlation identity, source/receiver and timestamp to follow the supported sequence. Keep EXT-900 with the technical message IDs so operations can connect the receiver error to the originating business instruction. A successful middleware hop can coexist with a rejected receiver application result.
Inspect sanitized error details and, where authorized, the relevant payload fields. Cloud ALM access distinguishes ordinary and sensitive monitoring data. Missing sensitive details can reflect permission scope, not absence of a payload. Use the appropriate authorized view and share only what the investigation needs; do not grant broad sensitive access merely to fill a screenshot. [4]
08 Route the incident using the first causal error
A receiver business validation normally needs the application/data owner and possibly mapping analysis. A destination authentication failure needs the connection/identity owner. A collection gap needs the monitoring integration owner. A component resource issue needs the relevant platform/service team with time-correlated evidence.
For the fixture, give the supplier-context owner the actual mapped supplier, target organizational context and message error. The platform team may still verify that service health is normal, but that observation is not the business correction. If many unrelated messages fail during a measured component outage, use that shared evidence while reconciling the eventual outcomes individually.
| Observation | Primary investigation | Concrete handoff |
|---|---|---|
| Supplier/business code rejected | Application data or mapping | Business key, target context and exact error |
| Authentication to receiver fails | Identity/connectivity | Destination context and sanitized auth error |
| Many messages fail with component issue | Platform/service plus integration | Metric/event time and affected message cohort |
| No current monitoring data | Collection/onboarding | Component/category, last data and collection error |
| Only old open alert remains | Alert lifecycle | Alert state and scope separate from time filter |
09 Do not confuse correlation with proof of cause
A CPU increase and an invoice rejection can occur at the same time without one causing the other. Compare the error mechanism. “Supplier not valid” points to a business prerequisite even if another metric is elevated. “Receiver unavailable” aligned with a verified outage supports a different hypothesis.
Use matched evidence to test the hypothesis: affected versus unaffected messages, component scope, error text and time sequence. Keep alternative explanations open when collection is incomplete. Do not manufacture a causal platform diagnosis from one red tile or dismiss a platform problem because one request happened to succeed.
10 Verify correction at the business and monitoring boundaries
After the actual supplier/mapping correction, use the supported controlled recovery for EXT-900. Verify the receiver created the intended invoice once with correct supplier, amount and context. Then inspect the new message outcome and relevant alert state. A reduction in error count can result from filter changes or data aging rather than successful recovery.
If the incident involved collection, verify new current data and an agreed test message appear in the correct scope. If it involved component health, compare the same metric definition and time window after correction. Keep the observation period explicit; one successful test does not prove continuous future health.
Unresolved original messages still need a disposition. A platform service returning to healthy does not automatically replay every failed business instruction or resolve ambiguous receiver commits. Reconcile accepted, failed and uncertain work before calling the business process recovered.
Make the recovery identity explicit. In an illustrative continuation, technical message MSG-900-A carries business reference EXT-900 and is rejected. After the approved correction, MSG-900-B carries the same business reference and the receiver creates fictional invoice INV-4711 for 100 EUR under the intended supplier context. Those are two technical attempts and one accepted business instruction. A monitor can legitimately retain the original error alongside the later success.
Build a small attempt ledger rather than subtracting dashboard totals. Link both technical IDs to EXT-900, preserve the original error and connect the accepted attempt to INV-4711. Verify amount, currency and supplier context in the authoritative receiver display. A successful second message for a different reference would not close EXT-900. Two successful technical messages likewise do not establish whether the receiver created one invoice or two.
Before sending MSG-900-B, establish whether an automatic retry is already pending and whether the first attempt left any uncertain receiver state. The fixture assumes the original rejection created no invoice; real timeout cases need a target search before replay. After acceptance, keep the failed attempt’s disposition recorded even if the business incident is closed. Alert acknowledgement, message status and business reconciliation are related evidence with different lifecycle meanings.
| Technical attempt | Business reference | Receiver result | Business conclusion |
|---|---|---|---|
| MSG-900-A | EXT-900 | Rejected; no invoice under stated fixture | Original failure retained |
| MSG-900-B | EXT-900 | INV-4711; 100 EUR; intended supplier | One accepted invoice to reconcile |
11 Exercise positive, negative and boundary cases safely
For a positive development fixture, trace one valid invoice across the collected message chain and verify its receiver result. For a negative fixture, use an agreed business-invalid instruction and demonstrate that the integration owner can find its actionable error while health checks remain otherwise normal. This teaches the distinction without inducing a production outage.
For boundaries, select the wrong permitted component or a period excluding the fixture and confirm that the analyst detects the mismatch before concluding no error occurred. Inspect an older open alert with a narrowed message window and explain its continued visibility. Also verify how the authorized non-sensitive role behaves when payload detail is restricted.
Use the service-specific setup documentation for any collection or alert change. This tutorial does not configure an automation, send notifications or execute an operational procedure. It provides proposed checks and a documentation-grounded investigation path.
12 Close with a reproducible evidence bundle
Record managed component, monitoring application, category/metric, scope, time frame/timezone, data freshness, message/business IDs, causal error, correction and receiver result. Include the responsible owner and unresolved gaps. Another operator should be able to reproduce the observation without guessing which green or red tile mattered.
Can a green health dashboard coexist with a failed invoice? Yes, the views address different evidence. Does an empty message list prove no failure? Only within configured, current and correctly selected collection scope. The related Completed-response and asynchronous-success lessons explain why a technical monitoring outcome still needs its business interpretation.
Related services and next steps
Primary sources
Found this useful?
Share this guide with your network, or leave a like.
Your like is saved in this browser.