Measuring point versus counter: Read condition and usage data correctly
A factory records both machine condition measurements and an accumulating usage counter to support maintenance decisions.

Source review:
START HERE · NO PRIOR TOPIC KNOWLEDGE NEEDED
What it is. Why it matters.
A measuring point records an asset condition such as temperature. A counter records accumulated usage such as operating hours; the distinction affects how readings are interpreted.
Completely new to SAP?
Manufacturers use SAP to connect work such as buying components, recording inventory, planning production, shipping equipment and accounting for costs. SAP S/4HANA is an enterprise resource planning system: it connects these activities through shared business data.
Plant Maintenance organizes care of technical assets. A notification reports a need; an order plans work; recorded execution and costs explain what was actually done.
A transaction code, or t-code, is a shortcut to a task in classic SAP GUI. Fiori apps provide another way to work. Names and screens depend on the product and release; you do not need a live system to learn the concepts in this guide.

Scope and source-review notes
Scope and evidence
Source review by FAST SAP SOLUTIONS® editorial. This badge describes our editorial review; it does not represent SAP certification or independent endorsement.
SAP ERP/S/4HANA measuring-point,counter and measurement-document concepts. Examples use a rising operating-hours counter;decreasing counters,overflow and corrections require the actual point configuration.
Documentation review on 14 November 2026 used the official SAP sources listed below, including indexed excerpts where full text was unavailable. Scope and availability depend on the stated product, release and configuration. All document references, quantities, dates and outcomes in worked cases are illustrative; no customer SAP system or tenant was accessed and the proposed exercises were not executed.
A MANUFACTURING EXAMPLE
Read machine condition and running hours
Absolute hours and interval usage differ
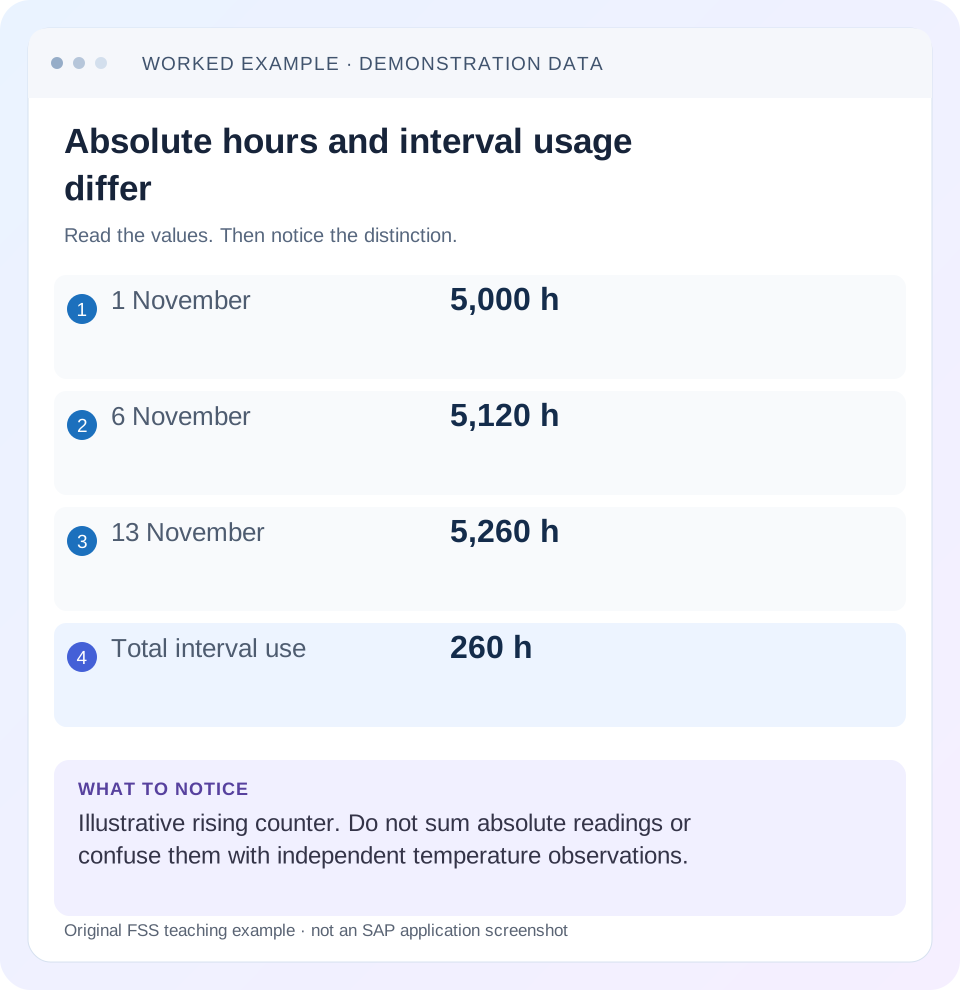
Read the example values
- 1 November
- 5,000 h
- 6 November
- 5,120 h
- 13 November
- 5,260 h
- Total interval use
- 260 h
Words you’ll meet in this guide
- Technical object
- An asset or location maintained in the system.
- Notification
- A report of an issue or maintenance need.
- Settlement
- Transfer of collected costs under accounting rules.
Preview the practical steps
SEE THE CONNECTION
See it in a simple example.
A small example to make the idea concrete.
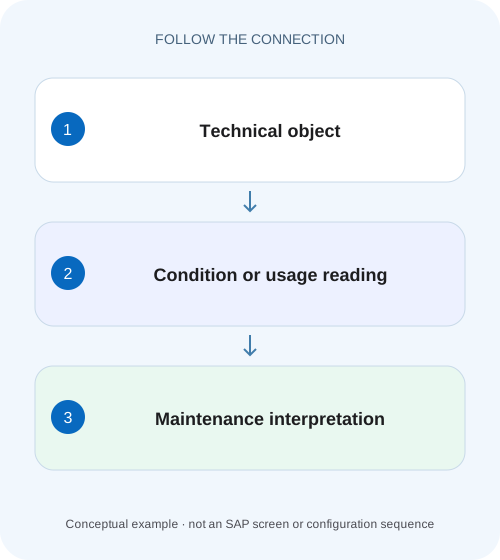
Read machine condition and running hours
A factory records both machine condition measurements and an accumulating usage counter to support maintenance decisions.
Condition and accumulated usage answer different questions
A measuring point identifies where an asset observation is recorded.
Understand the counter's accumulated meaning
SAP describes counters as representing wear, consumption or reduction in useful life, and as a basis for counter-based maintenance.
Keep master data and reading documents separate
The point/counter master defines the observation context, including technical object and relevant unit/range settings.
Read machine condition and running hours
A factory records both machine condition measurements and an accumulating usage counter to support maintenance decisions.
Distinguish readings from counter values and compare the relevant dates and units before calculating usage or inferring a maintenance trigger.
| Reader | Business question | Evidence to carry forward |
|---|---|---|
| Factory quality and maintenance teams | Read machine condition and running hours | Distinguish readings from counter values and compare the relevant dates and units before calculating usage or inferring a maintenance trigger. |
01 Condition and accumulated usage answer different questions
A measuring point identifies where an asset observation is recorded. A counter is a special measuring point representing cumulative progress, such as operating hours or distance. The recorded observation is a measurement document with its own time, value and unit. A bearing temperature of 70°C and a total of 5,000 operating hours cannot be interpreted through the same arithmetic.
This guide is for maintenance technicians, planners and analysts reviewing readings. You need the technical object, point/counter ID, unit, measurement timestamp and prior documents. The examples are fictional and concern data interpretation. They do not prescribe equipment limits or a physical maintenance decision.
02 Understand the counter's accumulated meaning
SAP describes counters as representing wear, consumption or reduction in useful life, and as a basis for counter-based maintenance. Readings generally progress continuously upward or downward according to the counter, and supported overflow can occur. A current display reading is therefore different from the usage increment between two observations. [1]
If an hours counter changes from 5,000 to 5,120, the increment is 120 hours. Summing the two absolute readings to 10,120 hours does not measure usage in the interval. Similarly, a temperature changing from 70 to 74°C increased 4°C, but the two measurements do not represent 144°C of accumulated heat.
03 Keep master data and reading documents separate
The point/counter master defines the observation context, including technical object and relevant unit/range settings. Each measurement document records a transaction at a particular time. A current master-data display alone cannot reconstruct when usage accumulated or whether a later-entered reading describes an earlier observation.
For support evidence, capture both observation time and entry context where available. A reading entered today may have been taken yesterday. Sorting only by document-creation sequence can therefore misstate the physical timeline. Follow the installed correction and backdated-reading rules rather than assuming that the latest entered number is always the latest observed state.
04 Work a three-reading example
Suppose PUMP_001 has temperature point T1 and operating-hours counter H1. H1 shows 5,000 hours on 1 November,5,120 on 6 November and 5,260 on 13 November. Its interval usage is 120 and 140 hours, total 260. T1 records 70,74 and 71°C on those dates; those are separate condition observations.
If a maintenance threshold is illustrated at 5,300 total hours,40 hours remain after 13 November. That arithmetic does not predict a precise due date without a usage forecast and the plan's scheduling rules. A simple historical average can be a teaching estimate, but it is not a claim about SAP's configured forecast calculation.
| Date | H1 absolute hours | Interval usage | T1 temperature |
|---|---|---|---|
| 1 November | 5,000 h | Baseline | 70°C |
| 6 November | 5,120 h | 120 h | 74°C |
| 13 November | 5,260 h | 140 h | 71°C |
| Whole interval | Final 5,260 h | 260 h | Do not sum temperatures |
05 Inspect units before accepting an apparent jump
SAP's measuring-point guidance explains that entry and characteristic units can differ when they share the same measurement dimension and conversion is supported. A value in Fahrenheit must be interpreted with its unit before comparing it with Celsius. Hours cannot be converted into kilometers merely because both values are numeric. [2]
A fixed-factor discrepancy often indicates unit interpretation. Confirm whether a mobile/integration payload contains absolute reading or difference, which unit it uses and what the receiving point expects. Sending 120 as an absolute total when the intended event is an additional 120 hours can create a major inconsistency.
06 Follow a reading investigation in sequence
Select one disputed measurement and its adjacent observations. Compare identities and timestamps before changing values. An incorrect point assignment can make a perfectly plausible number wrong for the asset.
Confirm point identity
Match H1 to PUMP_001 and verify that it is configured as a counter.
Expected observation: The value represents cumulative hours.
Read adjacent documents
Record 5,000,5,120 and 5,260 with observation times and units.
Expected observation: Usage is calculated over the correct intervals.
Inspect input meaning
Determine absolute reading versus entered difference and supported conversion.
Expected observation: 120 additional hours is not mistaken for total 120.
Check planning usage
SAP documents Environment: Usage in MaintPlans from counter contexts where applicable.
Expected observation: The affected maintenance plan is identified before interpreting due work.
07 Handle overflow and replacement as distinct events
SAP documents counter overflow, such as a display wrapping from its maximum back to zero. With an illustrative rollover modulus 10,000, a move from 9,950 to 30 represents 80 additional units if one supported overflow occurred: 50 to reach rollover, then 30 afterward. Without the overflow context, the raw subtraction is misleading. [1]
A replaced physical meter is not automatically the same event as normal overflow. Record replacement/correction context and use the supported counter-maintenance process. Do not force a lower reading into the history by pretending it is ordinary usage. The data must preserve the relationship between the displayed meter and the accumulated total used for maintenance.
08 Troubleshoot implausible readings
Treat an unexpected value as an investigation trigger rather than silently clipping it to a convenient limit. A real operating change, wrong point, unit mismatch, backdated observation or integration duplication can each explain a surprising interval.
| Observation | Question | Next evidence |
|---|---|---|
| Reading falls on rising counter | Overflow, replacement or error? | Counter settings and event history |
| Usage doubles after interface retry | Duplicate differences? | Payload identity and document references |
| Temperature appears extreme | Wrong unit or real condition? | Entry unit, instrument and point |
| Later entry has earlier observation | Backdated measurement? | Observation timestamp and correction rules |
| Reading saved, no order | Planning not processed or not due? | Counter-plan usage and scheduling history |
| Hours total correct, interval wrong | Wrong baseline/sequence? | Adjacent measurement documents |
09 Verify positive, negative and overflow cases
The positive test reproduces 120,140 and 260 hours from the three absolute readings. The negative test attempts to treat 5,120 as a 120-hour difference and demonstrates the resulting incorrect total in a paper fixture. In a system test, use the installed validation behavior and record the actual message; do not manufacture a universal error code.
For a boundary test, model 9,950 to 30 with explicit one-overflow assumptions and confirm 80 units. Also test a reading at the same observation time under the process's documented duplicate/correction rules. Verify any downstream maintenance-call effect separately: successful measurement storage does not prove that scheduling ran.
10 Preserve the correction trail
If a reading is wrong, retain original document identity, observed value, intended correction, reason and any downstream consequence. A maintenance date that moved after a bad reading may need separate investigation even after the reading is corrected. Do not assume all follow-on objects are automatically recalculated or withdrawn.
For analysis exports, distinguish absolute totals, interval differences and condition values as separate measures. Averaging or summing them indiscriminately can create plausible-looking but meaningless dashboards. Include point ID, time and unit so another analyst can reconstruct the calculation.
11 Inspect a measurement document rather than only the latest meter value
SAP's measurement-document display references identify IK13 and distinguish measuring-point versus counter context. Use that display for a known document and record point/counter, technical object, observation date/time, entry unit, value and the relevant total/difference representation available in the application. A latest-value widget can hide exactly the earlier document needed to explain an interval. [3]
For the 6 November reading, capture 5,120 hours and its relationship to the 1 November 5,000 baseline. Then compare 13 November 5,260. If a support export labels every numeric column simply “reading,”rename the worksheet columns to absolute reading, interval difference and condition value before calculating. This prevents a perfectly valid document from becoming a misleading aggregate.
12 Calculate a usage-rate estimate while preserving its limits
From 1 to 6 November, the fixture accumulates 120 hours over 5 calendar days, an illustrative 24 hours/day. From 6 to 13 November, it accumulates 140 over 7 days, or 20 hours/day. A single average across the whole 12-day interval is 260/12≈21.67 hours/day. These are different historical rates, not contradictions in the counter.
With 40 hours remaining to the illustrative 5,300 threshold, a simple estimate using 20 hours/day is 2 days. Using 21.67 gives about 1.85 days. Neither is automatically the SAP maintenance plan's forecast, which can use its configured annual performance/scheduling assumptions and calendars. Keep the estimate labeled as a worksheet calculation and compare the plan's actual forecast separately.
If the counter is entered as differences by an integration, the 120-hour message must not be reapplied on retry as another 120 hours. Retain a stable source observation/reference and inspect resulting measurement-document identities under the implemented duplicate-control design. A physically plausible total can still be wrong if the same increment was entered twice.
Test one repeated observation and one legitimate later observation with the same numeric increment in an authorized integration fixture. The former should follow the intended duplicate/correction contract; the latter must remain a distinct event. Comparing value alone cannot identify duplicates, because two consecutive days can genuinely use the same number of operating hours.
13 Check whether a new reading changes the intended planning input
After a corrected H1 observation, inspect the maintenance plan's actual counter reference and next scheduling evidence. If the plan uses another counter, the correct H1 total cannot explain its forecast. If H1 is correct but scheduling has not processed the updated input, record that separate dependency. This closes the gap between valid measurement history and the maintenance date that the planner is trying to explain.
14 Questions and related practice
Is every measuring point a counter? No, counters are a special form. Can a counter rise forever without overflow context? The physical instrument and configured model determine that. Can a temperature point have a qualitative valuation? Applicable measurement processes can include valuation, but that does not turn temperature into cumulative usage.
Close with point/counter, asset, measurement times, units, absolute/difference meaning and affected plan. Continue with maintenance-plan items for work scope, call horizon for generation timing, and equipment/location for the technical identity that owns the observation.
Related services and next steps
Primary sources
Found this useful?
Share this guide with your network, or leave a like.
Your like is saved in this browser.