SAP ST02 buffer analysis: Read swaps, hit rates and the observation period
A manufacturer's operational reports slow during a specific interval despite an apparently healthy lifetime buffer ratio.

Source review:
START HERE · NO PRIOR TOPIC KNOWLEDGE NEEDED
What it is. Why it matters.
A buffer keeps frequently used information in memory to avoid repeated work. ST02 shows buffer-related statistics, which help administrators investigate how that memory is being used.
Completely new to SAP?
Manufacturers use SAP to connect work such as buying components, recording inventory, planning production, shipping equipment and accounting for costs. SAP S/4HANA is an enterprise resource planning system: it connects these activities through shared business data.
SAP Basis work keeps relevant SAP systems running. Logs, background jobs and connection tools help explain what happened to a task at a particular time.
A transaction code, or t-code, is a shortcut to a task in classic SAP GUI. Fiori apps provide another way to work. Names and screens depend on the product and release; you do not need a live system to learn the concepts in this guide.

Scope and source-review notes
Scope and evidence
Source review by FAST SAP SOLUTIONS® editorial. This badge describes our editorial review; it does not represent SAP certification or independent endorsement.
Classic ABAP ST02 buffer and Tune Summary concepts for Basis/performance analysts. Buffer types, statistics and parameters depend on kernel and release. This is not a HANA-memory sizing recipe or a universal parameter recommendation.
Documentation review on 14 November 2026 used the available official SAP indexed excerpts; several SAP Help pages returned no readable full text. The worked case and proposed checks are original illustrative teaching material, not execution evidence from a customer SAP system. Exact fields, permitted actions and behavior must be confirmed against the installed product, release and configuration.
A MANUFACTURING EXAMPLE
Investigate a busy plant reporting interval
Read lifetime and interval separately
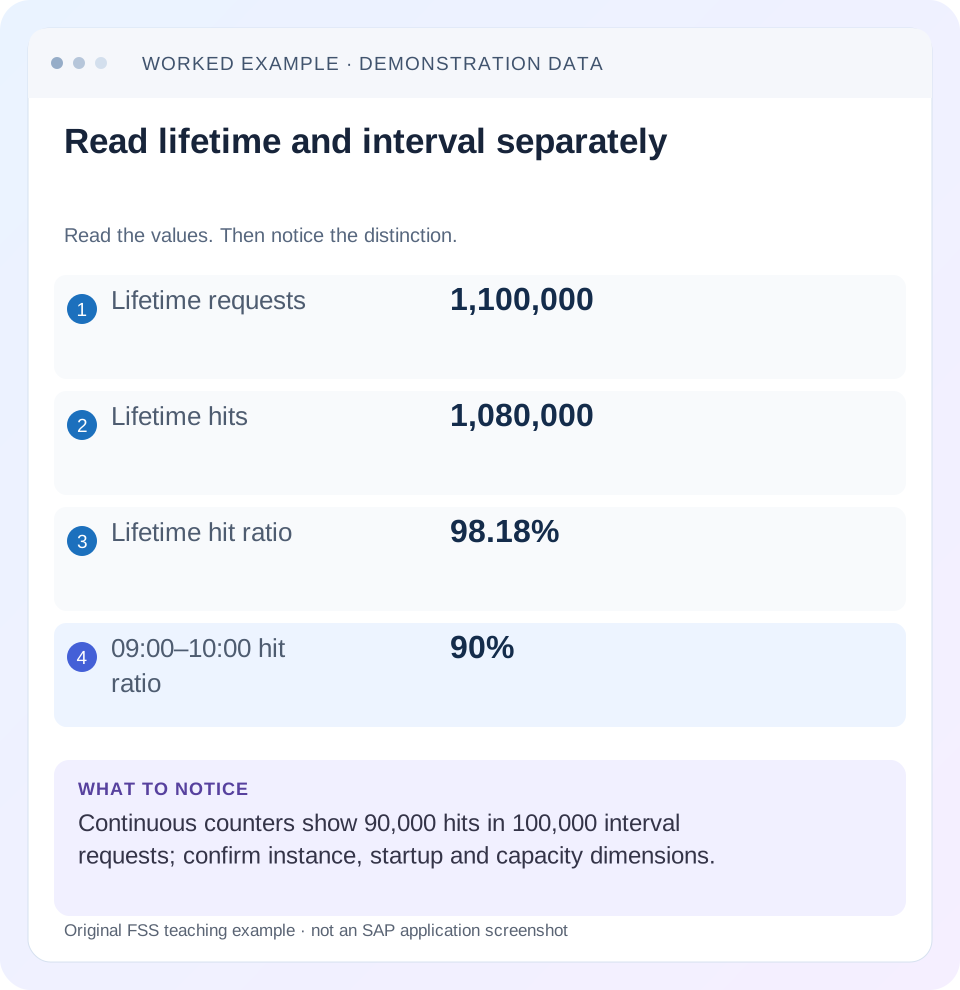
Read the example values
- Lifetime requests
- 1,100,000
- Lifetime hits
- 1,080,000
- Lifetime hit ratio
- 98.18%
- 09:00–10:00 hit ratio
- 90%
Words you’ll meet in this guide
- Instance
- A running SAP application-server environment.
- Client
- A logically separate data and configuration context in an ABAP system.
- Log
- A recorded sequence of events and messages.
- ABAP
- SAP’s programming language for business applications.
- HANA
- SAP’s database platform.
Preview the practical steps
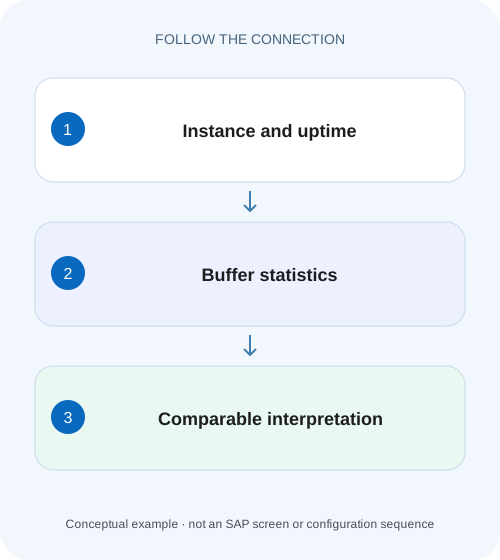
SEE THE CONNECTION
See it in a simple example.
A small example to make the idea concrete.
Investigate a busy plant reporting interval
A manufacturer's operational reports slow during a specific interval despite an apparently healthy lifetime buffer ratio.
Read the buffer and its observation period together
ST02 reports buffer and memory information for the relevant ABAP application-server instance.
Audience, prerequisites and measurement scope
This guide is for Basis and performance analysts with permitted ST02 display access.
Mechanism: cached objects, requests and replacement
A buffer serves eligible requests from objects already resident in memory.
Investigate a busy plant reporting interval
A manufacturer's operational reports slow during a specific interval despite an apparently healthy lifetime buffer ratio.
Compare interval evidence and relevant workload before using an overall ratio to dismiss or diagnose the performance problem.
| Reader | Business question | Evidence to carry forward |
|---|---|---|
| SAP developers and application teams supporting manufacturers | Investigate a busy plant reporting interval | Compare interval evidence and relevant workload before using an overall ratio to dismiss or diagnose the performance problem. |
01 Read the buffer and its observation period together
ST02 reports buffer and memory information for the relevant ABAP application-server instance. SAP's Tune Summary documentation describes statistics accumulated since server startup. Record that startup context before comparing counters or deciding that a displayed value is abnormal. [1]
A hit ratio, a swap count and free bytes answer different questions. A high lifetime hit ratio can coexist with recent churn, while a nonzero lifetime swap count can reflect an old event. Diagnose the named buffer and a meaningful interval rather than treating every red number as a command to increase memory.
02 Audience, prerequisites and measurement scope
This guide is for Basis and performance analysts with permitted ST02 display access. Obtain the affected instance, incident interval, representative workload and relevant release documentation. You need at least two comparable observations to reason about counter changes, and you must know whether a restart or reset occurred between them.
ABAP application buffers are separate from database buffer or HANA memory management. ST02 includes several resource categories; do not combine unlike figures into one memory diagnosis. Parameter changes require the installed buffer's documented sizing mechanism and host-memory context. This tutorial develops evidence for such a decision rather than prescribing a universal setting.
03 Mechanism: cached objects, requests and replacement
A buffer serves eligible requests from objects already resident in memory. When a required object is absent, further work is needed to obtain it. Different ABAP buffers hold different kinds of objects, so program, screen and table-buffer observations should be interpreted within their own role.
SAP distinguishes logical requests, buffer reads, database accesses and buffer quality. Do not equate every logical request with one database call. Also distinguish a buffer miss from a failed table operation: not finding a business row and not finding an object in the buffer are different events with different meanings. [1]
04 Worked case: a good lifetime ratio hides a busy interval
Our fictional instance B started Monday morning. At Tuesday 09:00, a selected buffer has 1,000,000 logical requests and 990,000 hits. At 10:00 it has 1,100,000 requests and 1,080,000 hits. The lifetime ratio at 10:00 is approximately 98.18 percent, while the interval added 100,000 requests and 90,000 hits: a 90 percent interval ratio.
This arithmetic does not prove user impact. It shows why the lifetime percentage can hide a change during the complaint period. The next question is whether the interval's misses and replacement activity correlate with the affected workload and a constrained capacity dimension. All numbers are illustrative and are not a suggested SAP threshold.
| Metric | 09:00 | 10:00 | Interval |
|---|---|---|---|
| Logical requests | 1,000,000 | 1,100,000 | 100,000 |
| Hits | 990,000 | 1,080,000 | 90,000 |
| Hit ratio | 99% | 98.18% | 90% |
| Swapped objects | 200 | 2,200 | 2,000 |
05 Calculate deltas only across compatible observations
Subtract the earlier count from the later count for cumulative counters. Keep the same instance and buffer, and confirm continuity of the counter lifetime. A restart between observations invalidates a simple subtraction because the second snapshot begins a new population.
For the example, 1,080,000 minus 990,000 gives 90,000 interval hits. Divide by 1,100,000 minus 1,000,000 requests to obtain 0.90. Keep the original counts alongside the computed ratio so another analyst can reproduce it. If the installed view already reports interval statistics, verify its definition instead of subtracting figures that are not cumulative.
06 Separate free space from directory capacity
A buffer needs capacity to hold object content and capacity to identify/manage resident objects. SAP documents that a lack of free directory entries can prevent loading even when free bytes remain. Therefore, free memory alone cannot establish that a buffer has enough capacity for the working set. [1]
In a fictional continuation, B has substantial free bytes but almost no free directory entries during the busy hour. That pattern supports investigating directory pressure, not blindly increasing the byte allocation. Another buffer with few free bytes and many directories suggests a different question. Review the specific buffer's documented parameter relationships before choosing any change.
07 Interpret swaps as replacement evidence, not operating-system paging
ST02 buffer swaps refer to objects replaced to make room under the buffer's capacity constraints. They are not automatically the same as OS swap activity. Keep the resource names explicit so a host-memory diagnosis is not built from an ABAP-buffer counter. [1]
Suppose the lifetime swap counter increases from 200 to 2,200 over the hour. The interval contains 2,000 additional replacements, provided the counter is continuous. Compare with earlier comparable hours, directory/space observations and request volume. A historical total of 2,200 after weeks of uptime tells a different story from 2,000 new replacements in one busy hour.
08 Connect the buffer evidence to a user operation
Use workload/statistical evidence to establish whether affected requests spend time in relevant database or application processing during the same interval. If users complain about an external-service timeout while the selected ABAP buffer has no plausible role, the buffer observation may be incidental.
Also inspect workload change. A release, new batch, unusually broad report selection or changed object mix can alter the working set. The right response may involve application behavior or scheduling rather than capacity alone. A correlation becomes stronger when the same named workload repeatedly aligns with the same buffer pressure and timing change under comparable conditions.
09 Build a tuning hypothesis with a measurable prediction
A useful hypothesis says which resource is constrained, why the workload needs more of it and what observation should change. For directory pressure, the prediction might be reduced replacement growth during the same representative workload after an approved directory-capacity adjustment, with acceptable host-memory use.
Define the comparison period before the change. If a restart is required, allow for warm-up and record the new startup. Compare equivalent workloads rather than an old busy week against a fresh quiet minute. Include the user's response or statistical timings so the review distinguishes a prettier monitor from an actual operational improvement. [2]
10 Troubleshoot conflicting-looking readings
A high hit ratio with growing swaps can reflect a popular stable subset plus churn in the rest. Low hit ratio just after restart can reflect warm-up. Free bytes with no directory entries can reflect a metadata-capacity constraint. These observations are not contradictory once the denominator, time base and capacity dimensions are separated.
A lack of visible improvement after a change should trigger review of the original hypothesis. Perhaps the wrong instance was resized, the workload changed, the relevant resource was elsewhere or the user delay was unrelated. Do not continue increasing values simply because the first adjustment failed to change the symptom.
| Observation | Interpretation to test |
|---|---|
| Free bytes, no directories | Directory capacity may constrain objects |
| Low ratio after restart | Warm-up and short denominator |
| High ratio, new swaps | Stable hot subset plus churn is possible |
| Counters decrease | Restart/reset or incompatible selection |
| User delay unchanged | Reassess affected layer and workload |
11 Practice and verify the calculations
On paper, calculate the lifetime and interval ratios from the fixture. Then replace the 10:00 hit total with 1,089,000: the interval becomes 99,000 hits out of 100,000 requests, or 99 percent. The lifetime history stays large, but the recent behavior is different. This tests interpretation without running an expensive workload.
For a negative check, place a restart at 09:30 and reset the second counters to smaller numbers. The correct result is “not comparable by subtraction, ” not a negative miss rate. For a boundary check, give an interval with zero requests: a meaningful hit ratio cannot be computed from a zero denominator. Report no observed workload rather than perfect efficiency.
12 Create a counter worksheet for the busy hour
For instance B’s 09:00–10:00 interval, preserve the continuous counters and capacity dimensions before proposing tuning. The worksheet should make the 90 percent recent hit ratio and 2,000 new replacements reproducible while showing whether bytes or directories are the plausible constraint.
Consider a second capacity fixture with 10,000 directory entries all occupied but 30 percent free bytes. New distinct objects can still require replacement because directory capacity is the constraint. Now change the fixture to 5,000 free entries but almost no free bytes: the capacity question changes even if the swap delta is identical. These deliberately simplified combinations test whether the analyst follows the actual limiting dimension. They also show why an undifferentiated request to add buffer memory can be incomplete. The appropriate installed parameter and its memory effect must be tied to the named buffer and measured workload.
Capture comparable snapshots
Record buffer name, instance B, startup and the two observation times with logical requests, hits, swaps, free bytes and free directories. Preserve units and the view definition.
Expected observation: Both observations describe the same continuous population.
Compute the interval explicitly
Calculate request delta 100,000, hit delta 90,000 and replacement delta 2,000. Show the 90,000 divided by 100,000 formula next to the 98.18 percent lifetime display.
Expected observation: The reader can distinguish recent behavior from lifetime history.
Test the capacity hypothesis
Compare directory and byte availability during the same hour and pair that evidence with affected request timing. If directories are not constrained, reassess the proposed explanation before planning a sizing change.
Expected observation: The proposed change follows the observed limiting dimension.
13 Questions and a concise evidence record
Is there one correct hit-rate threshold for every buffer? This tutorial supplies none; buffer type, release, workload and user impact matter. Does free space prove the buffer is healthy? No; directory capacity and behavior over time also matter. Does ST02 diagnose HANA memory pressure? Use the appropriate database evidence for that separate resource.
A useful record states instance, buffer, startup, two timestamps, counters, delta calculations, free bytes/directories and correlated workload. Conclude with a bounded hypothesis and proposed verification. That gives Basis a reviewable measurement plan and prevents a lifetime counter from becoming an unsupported sizing instruction.
Related services and next steps
Primary sources
Found this useful?
Share this guide with your network, or leave a like.
Your like is saved in this browser.